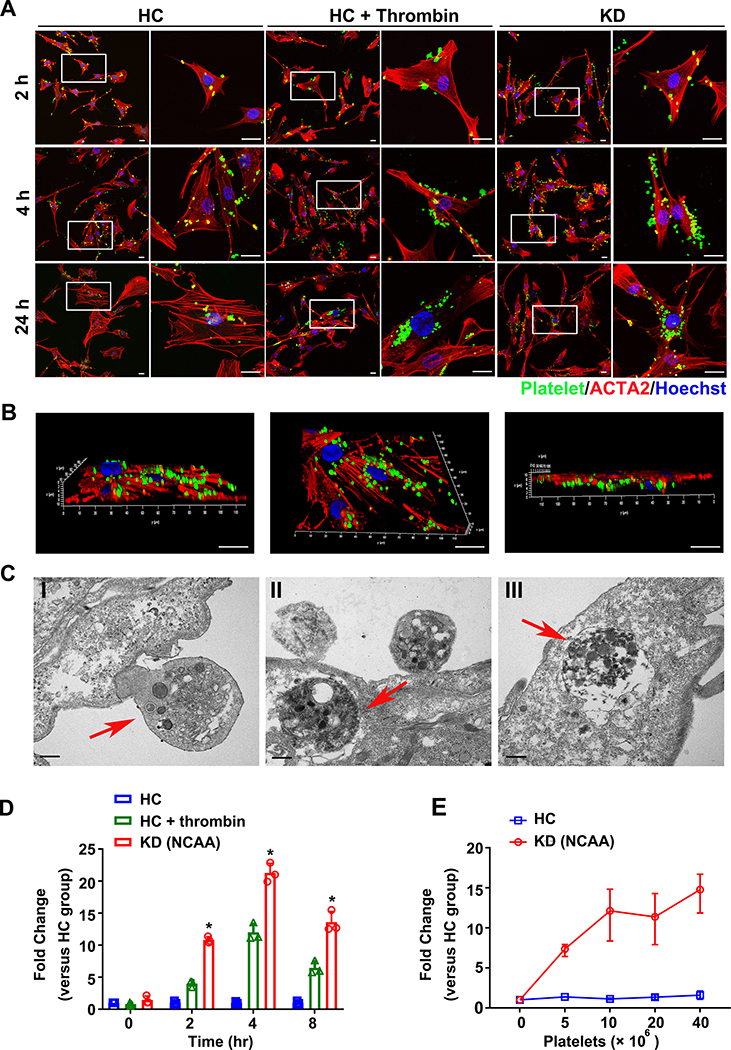
Figure 2. Activated KD platelets are internalized into VSMCs delivering miR-223 into VSMCs.
(A) Representative images of VSMCs co-cultured with CMFDA-labeled (green) KD platelets and unstimulated HC platelets, and thrombin stimulated HC platelets for 2, 4, 24 hours. VSMCs stained with ACTA2 (red) and nuclei visualized with Hochest (blue) (n=8). Scale bar: 20μm. (B) Three-dimensional reconstruction of confocal Z-stack images of the whole VSMCs co-cultured with CMFDA-labeled KD (green) platelets were shown at different orientations to demonstrate uptake and perinuclear localization (n=8). Scale bar: 20μm. (C) Transmission electron microscopy imaging of VSMCs co-cultured with KD platelets. The red arrow indicates the entering and internalized platelet. Scale bar: 500 nm. (D) Intracellular miR-223 level in VSMCs after incubation with platelets from unstimulated HC (n=3), thrombin-stimulated HC (n=3) and KD group (n=3) for 0, 2, 4, 8 hours, normalized to U6. The relative level of miR-223 in thrombin-stimulated HC group and KD group was calculated and normalized by HC group at each time point (Kruskall-Wallis test and Dunn’s multiple comparisons test). (E) Intracellular miR-223 level in VSMCs at 4 hours after incubation with increasing concentration of platelets from HC (n=3) and KD patients with NCAA (n=3). Results are normalized to U6. The relative level of miR-223 in KD group was calculated and normalized by HC group at each concentration (Mann Whitney test). Abbreviations: HC, VSMC co-cultured with platelets from HC; KD (NCAA), VSMCs co-cultured with platelets from KD patients with NCAA; HC+thrombin, VSMCs co-cultured with thrombin -stimulated HC platelets. *P<0.05 versus HC group.

