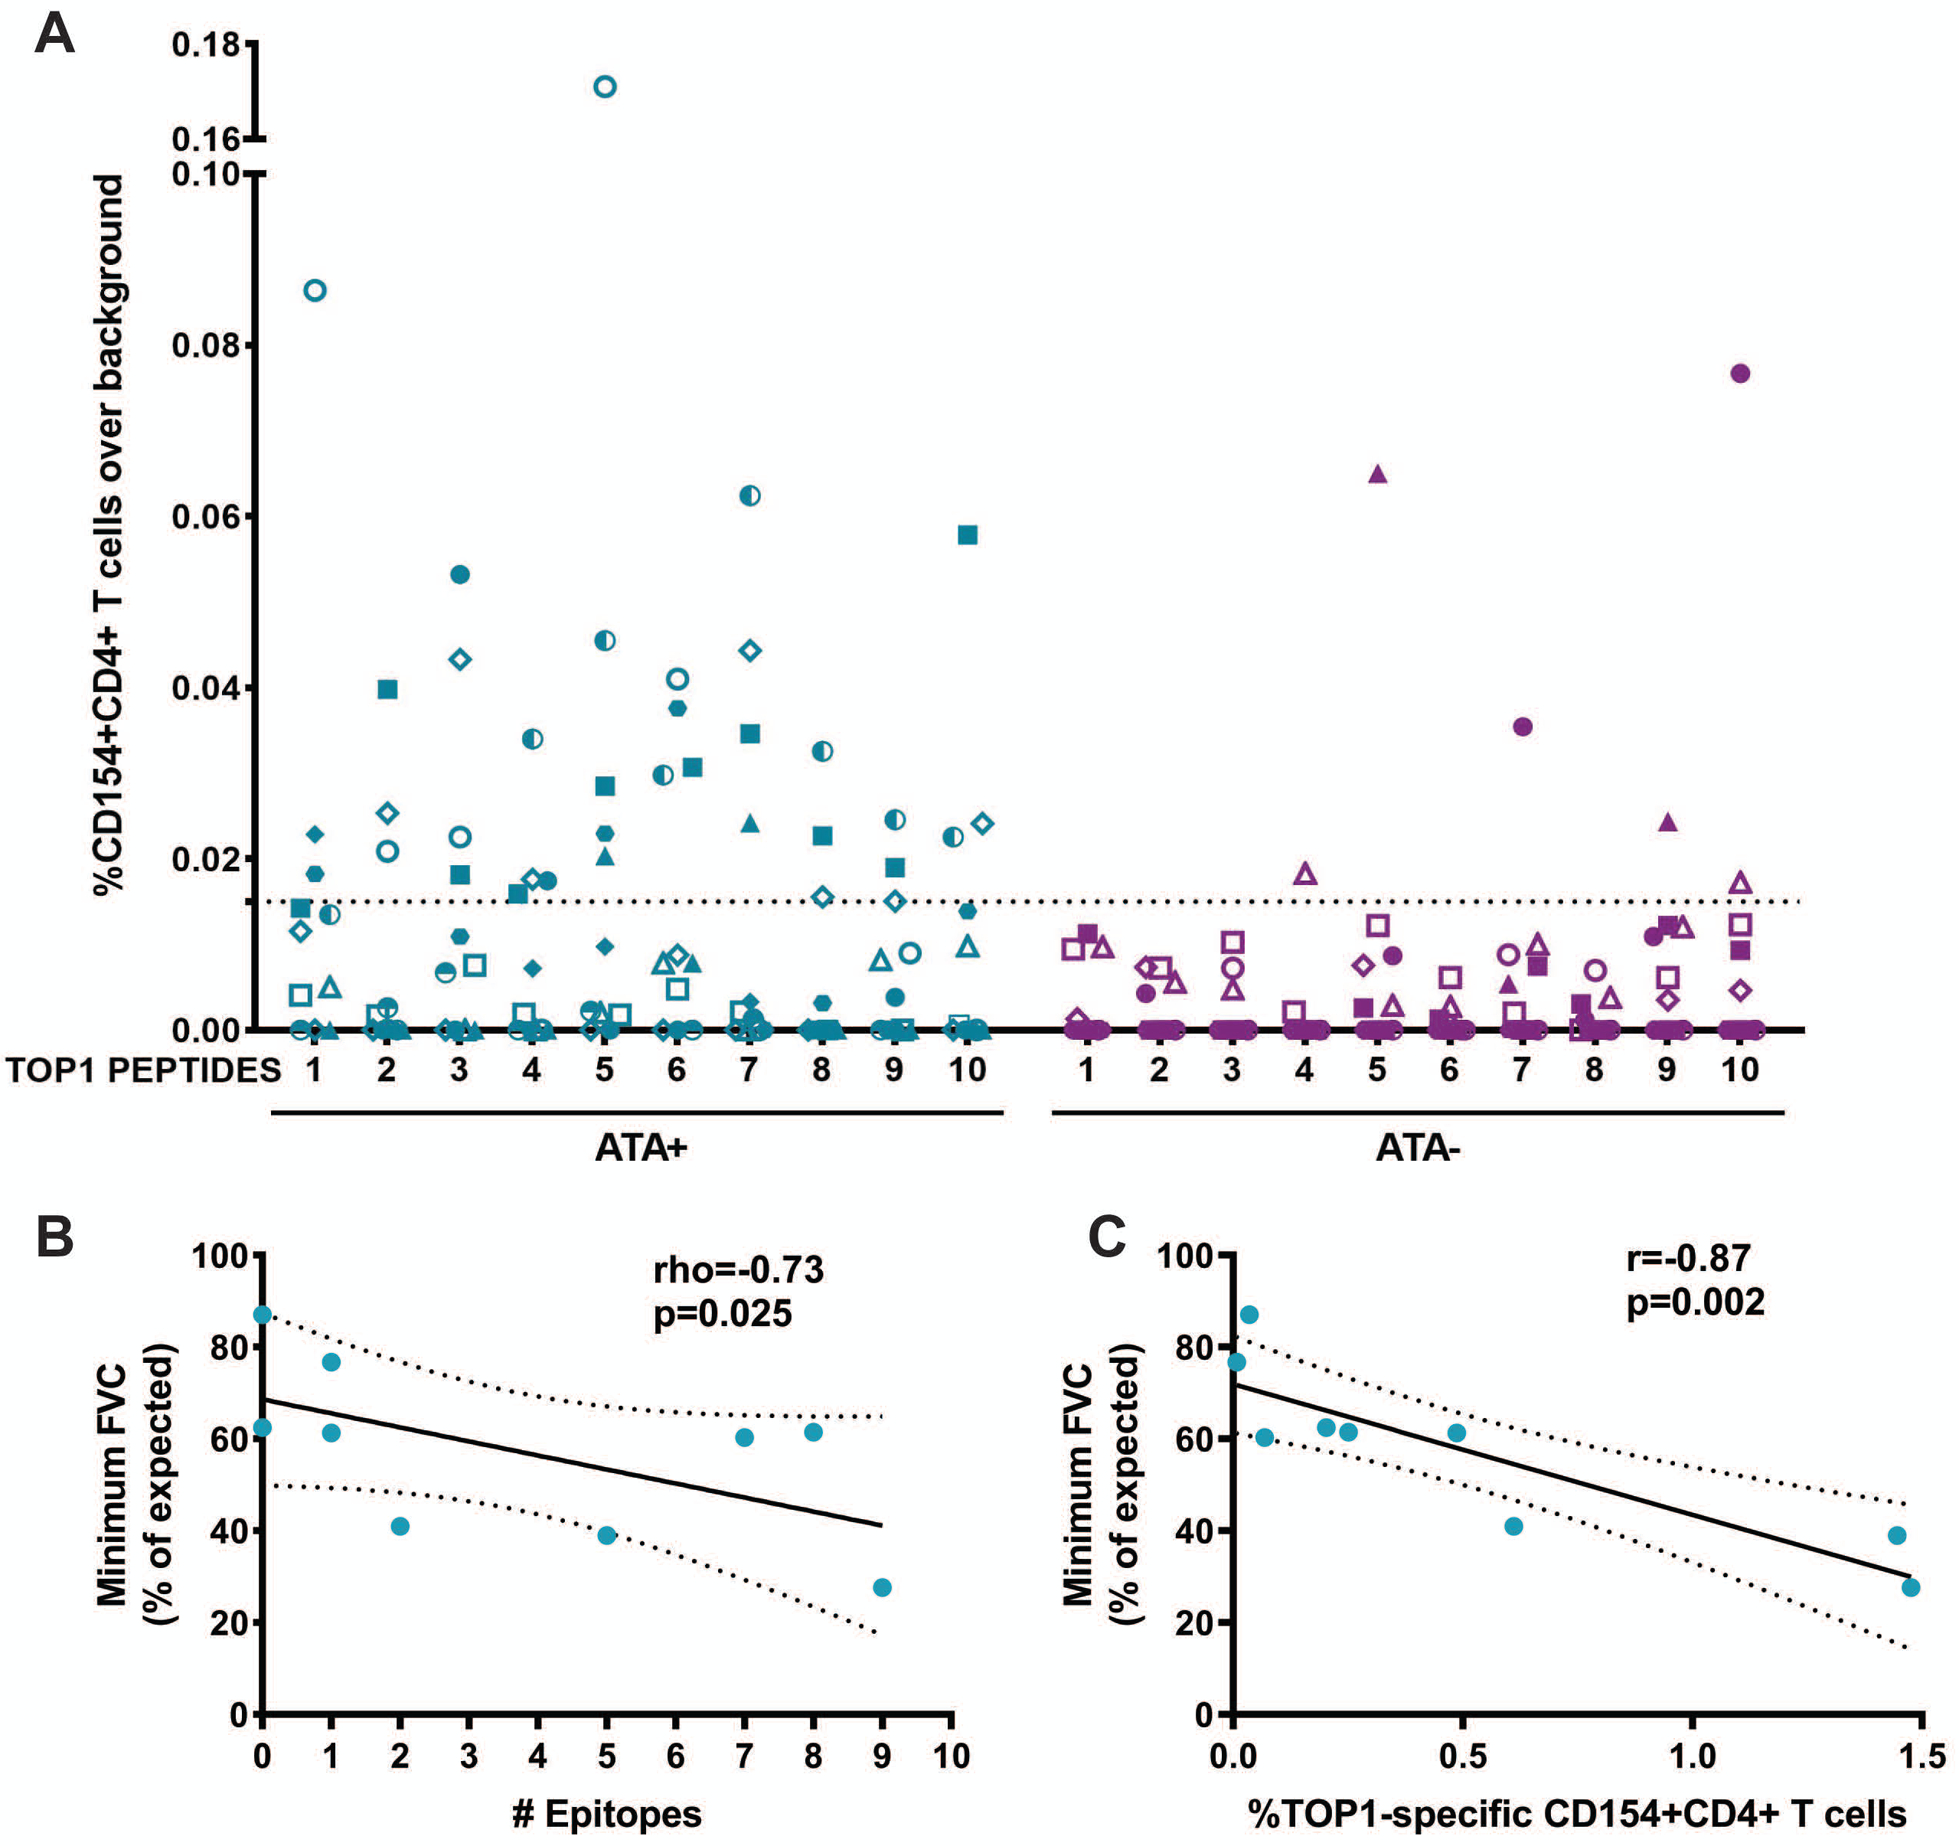
Figure 5. Distribution and clinical significance of CD4+ T cell responses to naturally presented TOP1 epitopes in scleroderma.

(A) %CD154+CD4+ T cell responses over background observed with media alone for 11 ATA-positive and 11 ATA-negative scleroderma patients for each of the 10 naturally processed TOP1 peptides identified using NAPA are shown. The dotted line represents the cutoff for positivity that was defined as >95th percentile of the T cell responses observed in ATA-negative patients (95th percentile=0.015%). Each unique colored symbol represents a different patient. The minimum FVC (% of expected) was plotted against (B) the number of TOP1 epitopes eliciting a T cell response and (C) the percentage of CD154+CD4+ T cells responses elicited against the whole TOP1 protein in ATA-positive scleroderma patients with clinically documented ILD (n=9). The correlation between minimum FVC and the number of stimulatory TOP1 epitopes was analyzed using a Spearman’s rho test, and the correlation with the magnitude of the T cell responses to the TOP1 protein was analyzed using a Pearson’s r test. A p-value <0.05 was considered significant throughout.
