Figure 1.
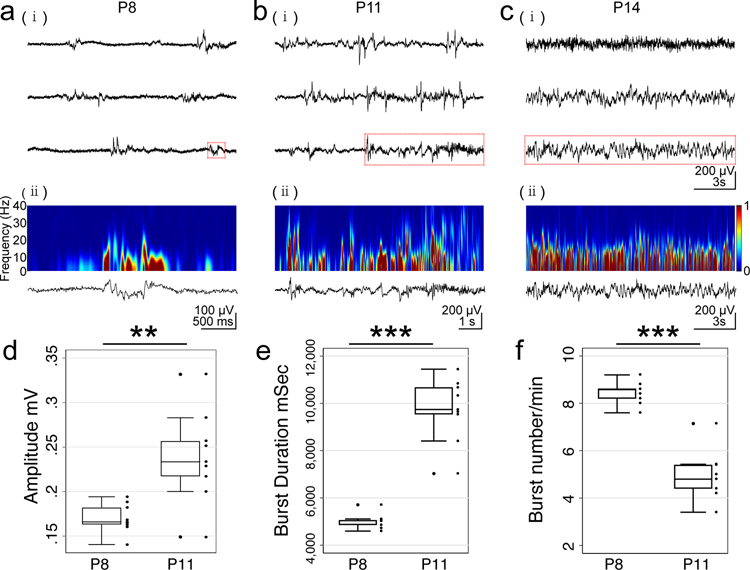
Developmental changes in EEG traces are shown for P8 (a), P11 (b) and P14 (c). Raw EEG (i) shows typical discontinuous activity with bursts followed by periods of no activity. Activity increases in both amplitude and burst frequency, becoming continuous around P14. Frequency spectrogram (ii) for a single burst of activity (highlighted in red in raw traces) is shown for each age. The activity includes both low frequency (0.5 – 2 Hz) activity and nested higher frequencies (8 – 20 Hz) characteristic of a spindle burst. Power is normalized from 0 to 1 (color scale). Quantification of developmental changes in EEG activity with increase in burst amplitude (d) and burst duration (e) with corresponding decrease in burst frequency (f) from P8 to P11. Bursts cannot be quantified by P14 as activity has become continuous.

