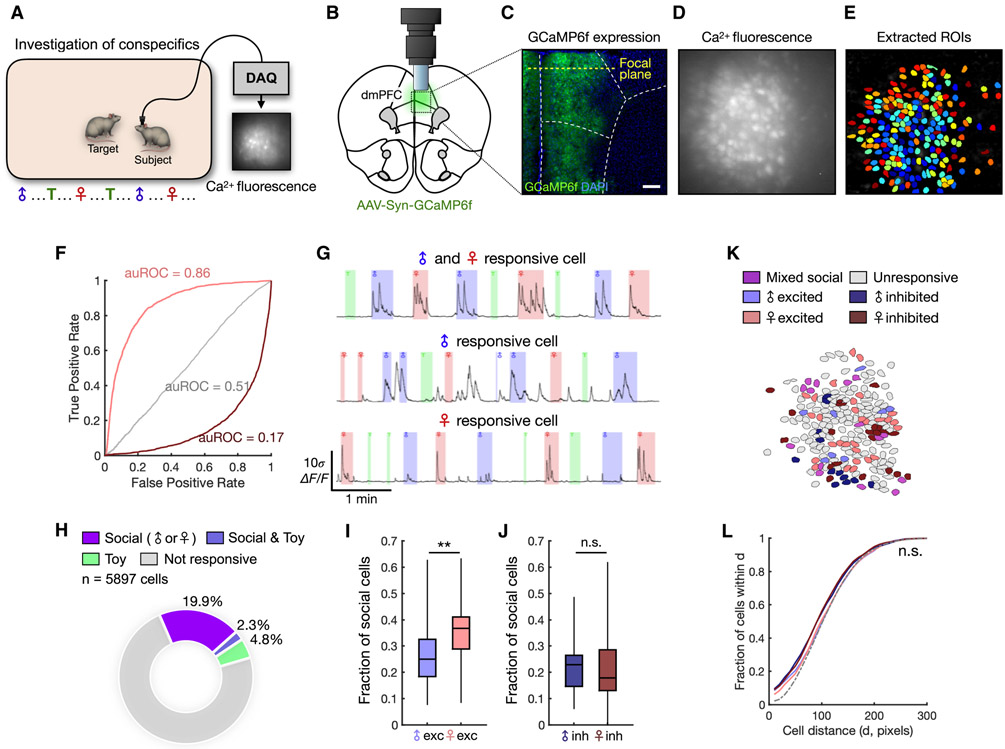
Figure 1. dmPFC neurons encode conspecific sex during natural interaction.
(A) Schematic of social investigation assay. Eight novel male and eight novel female conspecifics are presented interleaved with a novel object, and the subject animal is allowed to freely investigate.
(B) Illustration of the microendoscope placed above the dmPFC.
(C) Example image showing expression of GCaMP6f in neuronal cell bodies. The location of the focal plane is estimated based on the estimated working distance of the lens.
(D) Imaging field of view showing raw calcium fluorescence from one animal (max projection).
(E) ROIs corresponding to single neurons extracted from the field of view in (D).
(F) Receiver operating characteristic (ROC) curves computed from three example neurons that are female-excited (auROC = 0.86), female-suppressed (auROC = 0.17), or not responsive to female (auROC = 0.51).
(G) Example calcium traces from social-mixed (top), male (middle), and female (bottom) neurons.
(H) Distribution of social cells (responding to either male or female interaction) and toy-responsive cells from all recorded animals.
(I) Fractions of male- and female-excited cells among socially responsive dmPFC neurons recorded from males (p = 0.0071). Mixed cells responding to more than one category constituted 6.29 ± 1.18% (mean ± SEM) of socially responsive cells. We also observed a higher fraction of female-excited cells when normalizing the sampling of male and female investigation (see Methods, Figure S2A-B).
(J) Fractions of male- and female-inhibited neurons recorded from male animals (p = 0.59).
(K) Example field of view showing spatial locations of male and female cells.
(L) Cumulative histogram showing the mean fraction of cells within a given pairwise distance (x-axis), compared between subsets of functionally defined neurons.
In (H) n = 28 animals (including males and females); (I-J) Mann-Whitney U test, n = 23 animals; (L) two-sample Kolmogorov-Smirnov test, n = 23 animals. **p < 0.01, n.s. = not significant. Scale bar = 200 μm.

