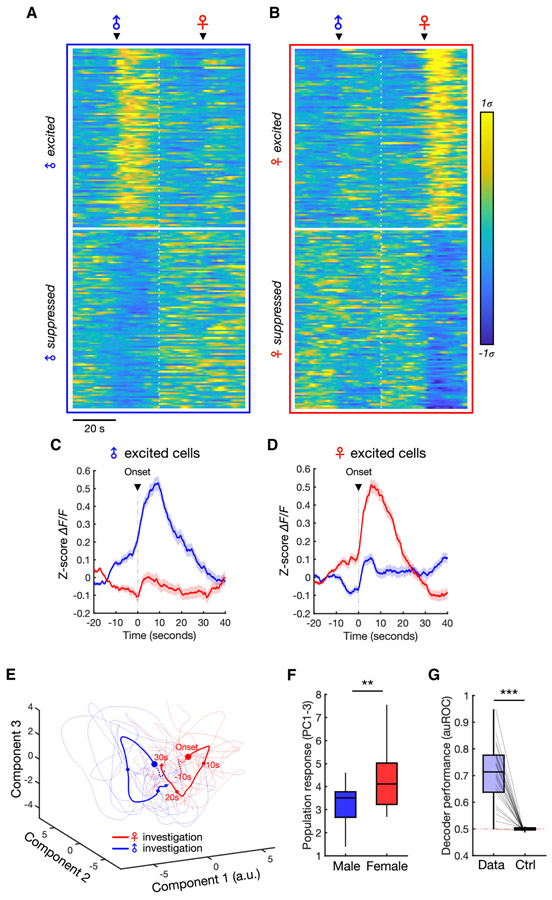
Figure 2. Population representations of male and female.
(A-B) Average responses of male (A) and female (B) neurons centered around investigation onset. The top 100 neurons, sorted using rank-ordered auROC values, are shown for each cell type (showing excited or inhibited responses).
(C-D) Average responses of all male-excited (C) and female-excited (D) neurons during male and female investigation (mean ± SEM).
(E) Principal component projection of population dynamics during individual male and female investigation bouts (thin lines) and average responses (thick lines) from one example animal. Dots indicate 10-second time intervals and dotted lines indicate time before investigation onset.
(F) Comparison of the population response amplitude during male vs. female interaction in male animals. Population responses (projected to PC1-3) are measured over the first 10 seconds of interaction and averaged across bouts within each animal (Mann-Whitney U test, p = 0.0095, n = 23 animals).
(G) Performance of Fisher’s linear discriminant (FLD) decoders trained to classify male vs. female investigation using population dynamics. Cross-validated auROC is compared with performance of null models trained and tested using time-permuted calcium traces (Wilcoxon signed-rank test, p = 2.7e-5, n = 23 animals).
***p < 0.001, **p < 0.001
See also Figure S1.

