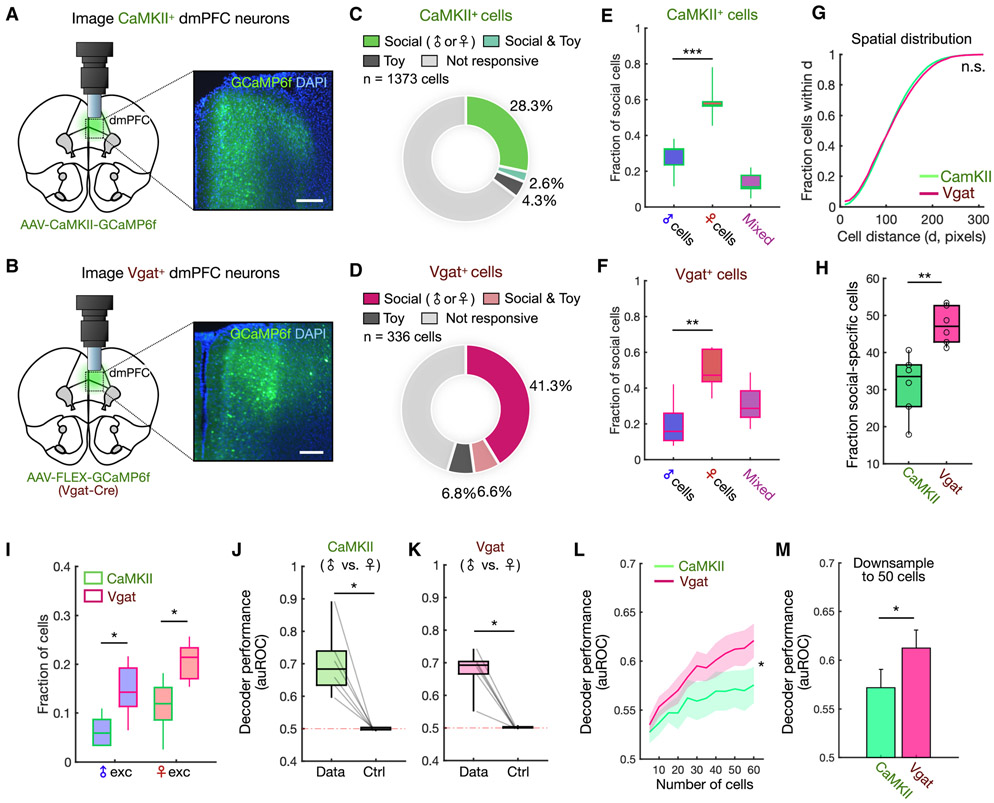
Figure 3. dmPFC encoding of sex is distributed across distinct neuronal subpopulations.
(A-B) Schematic showing lens and microscope placement above dmPFC (left) and expression of GCaMP6f in CaMKII+ or Vgat+ neuron cell bodies (right). CaMKII-GCaMP labeled 25.4 ± 2.6% of dmPFC cells, and Vgat-GCaMP labeled 9.6 ± 0.3% of dmPFC cells (mean ± SEM).
(C-D) Distribution of social (male and/or female responsive) and toy-responsive neurons among CaMKII+ (n = 1373) or Vgat+ (n = 336) cells.
(E-F) Comparison of fractions of male and female cells within the CaMKII+ or Vgat+ population (E, p = 0.0001; F, p = 0.0015). We also observed a higher fraction of female cells when normalizing the sampling of male and female investigation (see Methods, Figures S2C-D).
(G) Cumulative histogram showing the mean fraction of cells within a given pairwise distance (x-axis) for CaMKII+ and Vgat+ neurons.
(H) Comparison of the percentage of social cells identified in CaMKII+ vs. Vgat+ populations (p = 0.0043).
(I) Fractions of male- and female-excited cells within the CaMKII+ and Vgat+ populations (male-excited, p = 0.031; female-excited, p = 0.012).
(J-K) Performance of Fisher’s linear discriminant (FLD) decoders trained to classify male vs. female investigation using the CaMKII+ or Vgat+ population. Cross-validated auROC is compared with performance of null models trained using time-permuted calcium traces (J, p = 0.0312; K, p = 0.0312).
(L) Decoder performance in CaMKII+ and Vgat+ cell populations as a function of ensemble size (mean ± SEM, p = 0.040 number/cell type interaction).
(M) Decoder performance of CaMKII+ vs. Vgat+ cell populations after down-sampling ensembles to 50 neurons (mean ± SEM, p = 0.0411).
In (E-F), one-way ANOVA followed by Tukey’s range test; (G) two-sample Kolmogorov-Smirnov test; (H), (M) Mann-Whitney U test; (I) Tukey’s range test; (J-K) Wilcoxon signed-rank test; (L) two-way repeated measures ANOVA. n = 6 animals for each group (CaMKII+ and Vgat+).
***p < 0.001, **p < 0.01, *p < 0.05, n.s. = not significant. Scale bar = 200 μm.
See also Figure S2.

