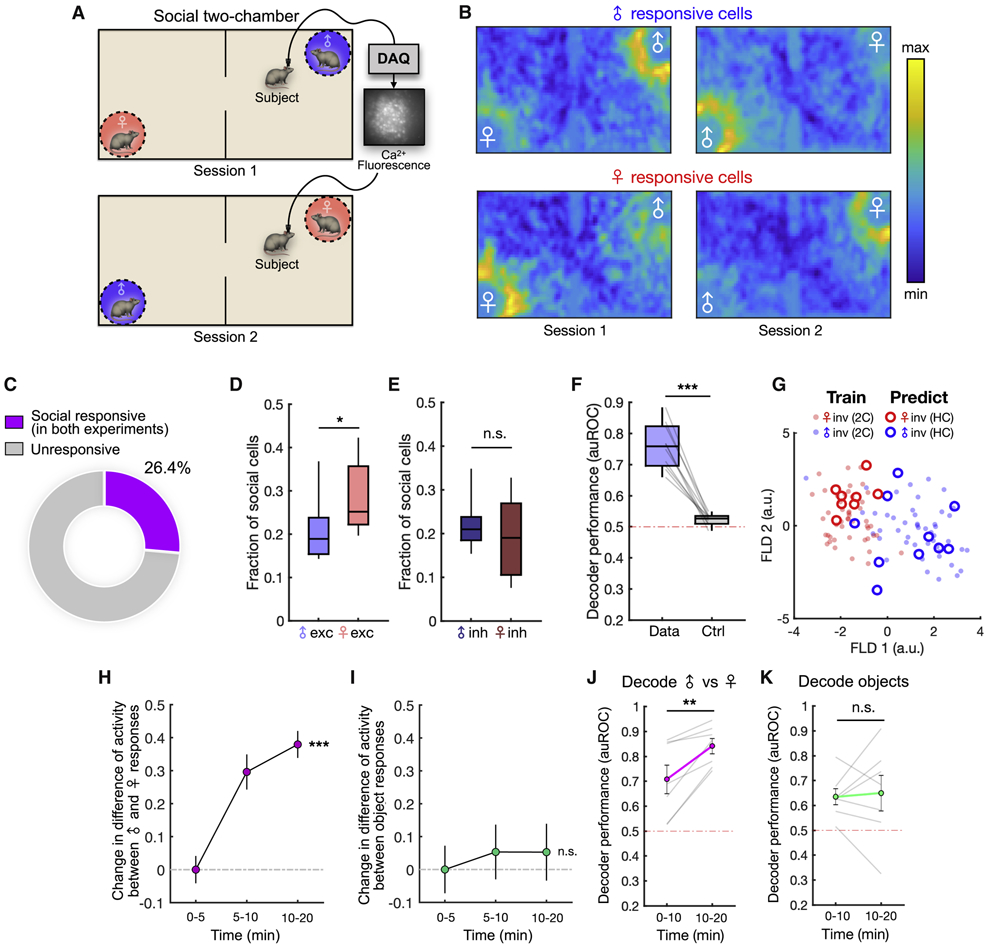
Figure 4. Encoding of conspecific sex across contexts and experience-dependent changes.

(A) Illustration of the two-chamber social exploration task. Male and female locations are switched across two sequential sessions.
(B) Neural activity heat maps showing mean responses of male-excited (top) and female-excited (bottom) neurons during the two-chamber assay.
(C) Distribution of social (male or female responsive) dmPFC neurons that are significantly responsive across both the home cage social investigation and two-chamber assays.
(D) Fractions of male- and female-excited cells that consistently encode sex information across both the home cage and two-chamber sessions (p = 0.031).
(E) Fractions of male- and female-suppressed cells that encode sex information across sessions (p = 0.450).
(F) Performance of Fisher’s linear discriminant (FLD) decoders trained using data from both the social investigation and two-chamber assays and tested on data from both. Cross-validated auROC is compared to control decoders constructed using time-permuted calcium traces (p = 0.002).
(G) Projection of mean population responses associated with male and female investigation bouts from the home cage (circles) and two-chamber (solid dots) onto FLD components computed from two-chamber data. The discrimination axis (FLD 1) generalizes to events in the home cage. Performance of cross session decoders using sex-selective cells are shown in Figures S3A-B.
(H) Change in activity difference of male and female cells evoked by male vs. female investigation during different time epochs in the two-chamber (mean ± SEM, p = 0.0001). Stimulus-evoked activity in each epoch is normalized to overall population activity.
(I) Change in activity difference of object-excited cells during investigation of one object vs. the other object (mean ± SEM, p = 0.10). Stimulus-evoked activity in each epoch is normalized to overall population activity.
(J) Performance of decoders to discriminate male vs. female investigation using population dynamics during the first and second half of the two-chamber session (animal locations not switched, p = 0.016).
(K) Performance of decoders to discriminate investigation of different objects using population dynamics during the first and second half of non-social two-chamber experiments (p = 0.69).
In (D-E), Mann-Whitney U test, n = 10 animals; (F) Wilcoxon signed-rank test, n = 10 animals; (H-I) One-way ANOVA, n = 291 cells (H), n = 115 cells (I); (J-K) Wilcoxon signed-rank test, n = 7 animals.
***p < 0.001, **p < 0.01, *p < 0.05, n.s. = not significant.
See also Figure S3.
