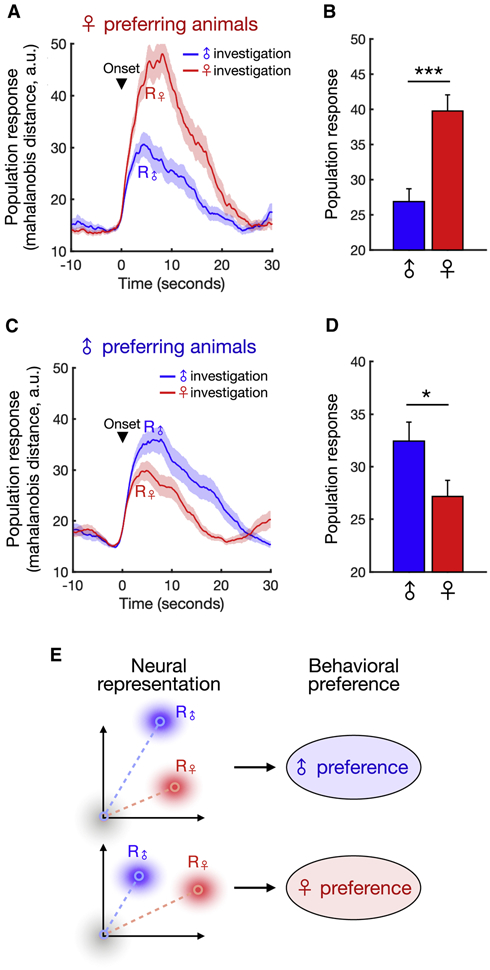
Figure 5. dmPFC neurons encode a sex preference state.

(A, C) Average population response, measured as the Mahalanobis distance between trial response vectors and baseline (see Methods) for male- and female-preferring animals evoked during male or female interaction (mean ± SEM).
(B, D) Average responses in (A) and (C) quantified over the first 10 seconds of interaction (mean ± SEM, Mann-Whitney U test, p = 1.26e-4, n = 46 male bouts and n = 42 female bouts (b), p = 0.0195, n = 60 male bouts and n = 66 female bouts (D)).
(E) Schematic showing how the relative strength of sex-specific responses predicts individual sex preference.
***p<0.001, *p < 0.05.
See also Figure S4.
