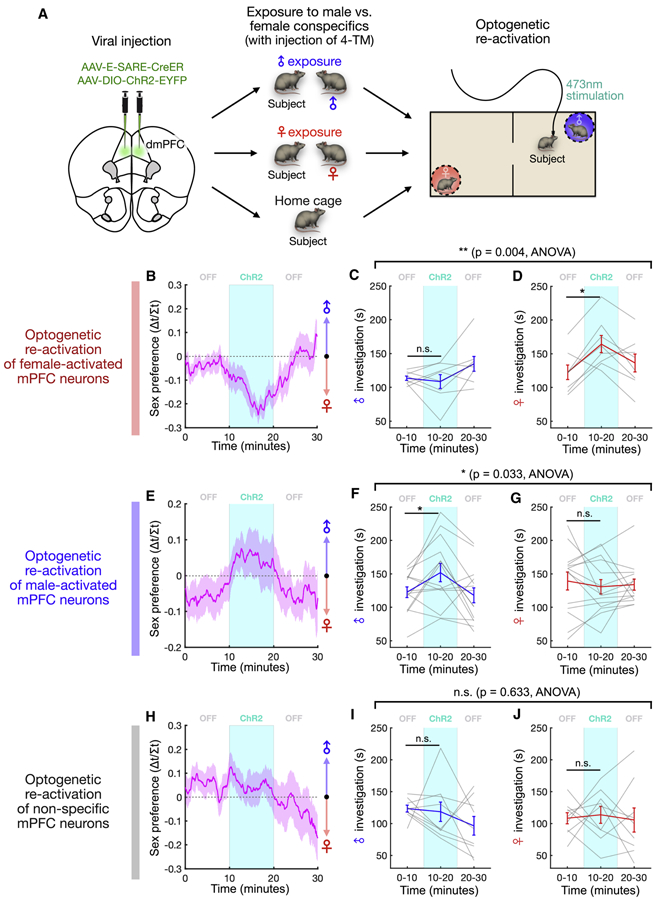
Figure 6. Male and female cells modulate male vs. female interaction.

(A) Experimental paradigm used to test the causal role of male and female representations in sex preference behavior. After viral injection of E-SARE-CreER and Cre-dependent ChR2 constructs, animals interact with either male or female conspecifics followed by tamoxifen injection, and activity-defined cells are optically stimulated in the social two-chamber (see Methods).
(B, E, H) Time course of sex preference in the male/female two-chamber session (mean ± SEM). Optical stimulation of female cells induces a bias toward female interaction (B), stimulation of male cells induces a bias toward male interaction (E), and stimulation of non-specific cells induces no bias (H).
(C-D) Male or female interaction time (%) before, during, and after stimulation of female-activated neurons (mean ± SEM, p = 0.004, light/sex interaction in two-way repeated measures ANOVA; C, p = 0.84, D, p = 0.016, Wilcoxon signed-rank test; n = 8 animals).
(F-G) Male or female interaction time (%) before, during, and after stimulation of male-activated neurons (mean ± SEM, p = 0.033, light/sex interaction in two-way repeated measures ANOVA; F, p = 0.042, G, p = 0.50, Wilcoxon signed-rank test; n = 14 animals).
(I-J) Male or female interaction time (%) before, during, and after stimulation of non-specific neurons (mean ± SEM, p = 0.63, light/sex interaction in two-way repeated measures ANOVA; I, p = 0.36, J, p = 0.32, Wilcoxon signed-rank test; n = 9 animals).
***p<0.001, *p < 0.05, n.s. - not significant.
See also Figures S5 and S6.
