
Extended Data Figure 1 |. CR8-induced degradation of cycK correlates with DDB1 expression.
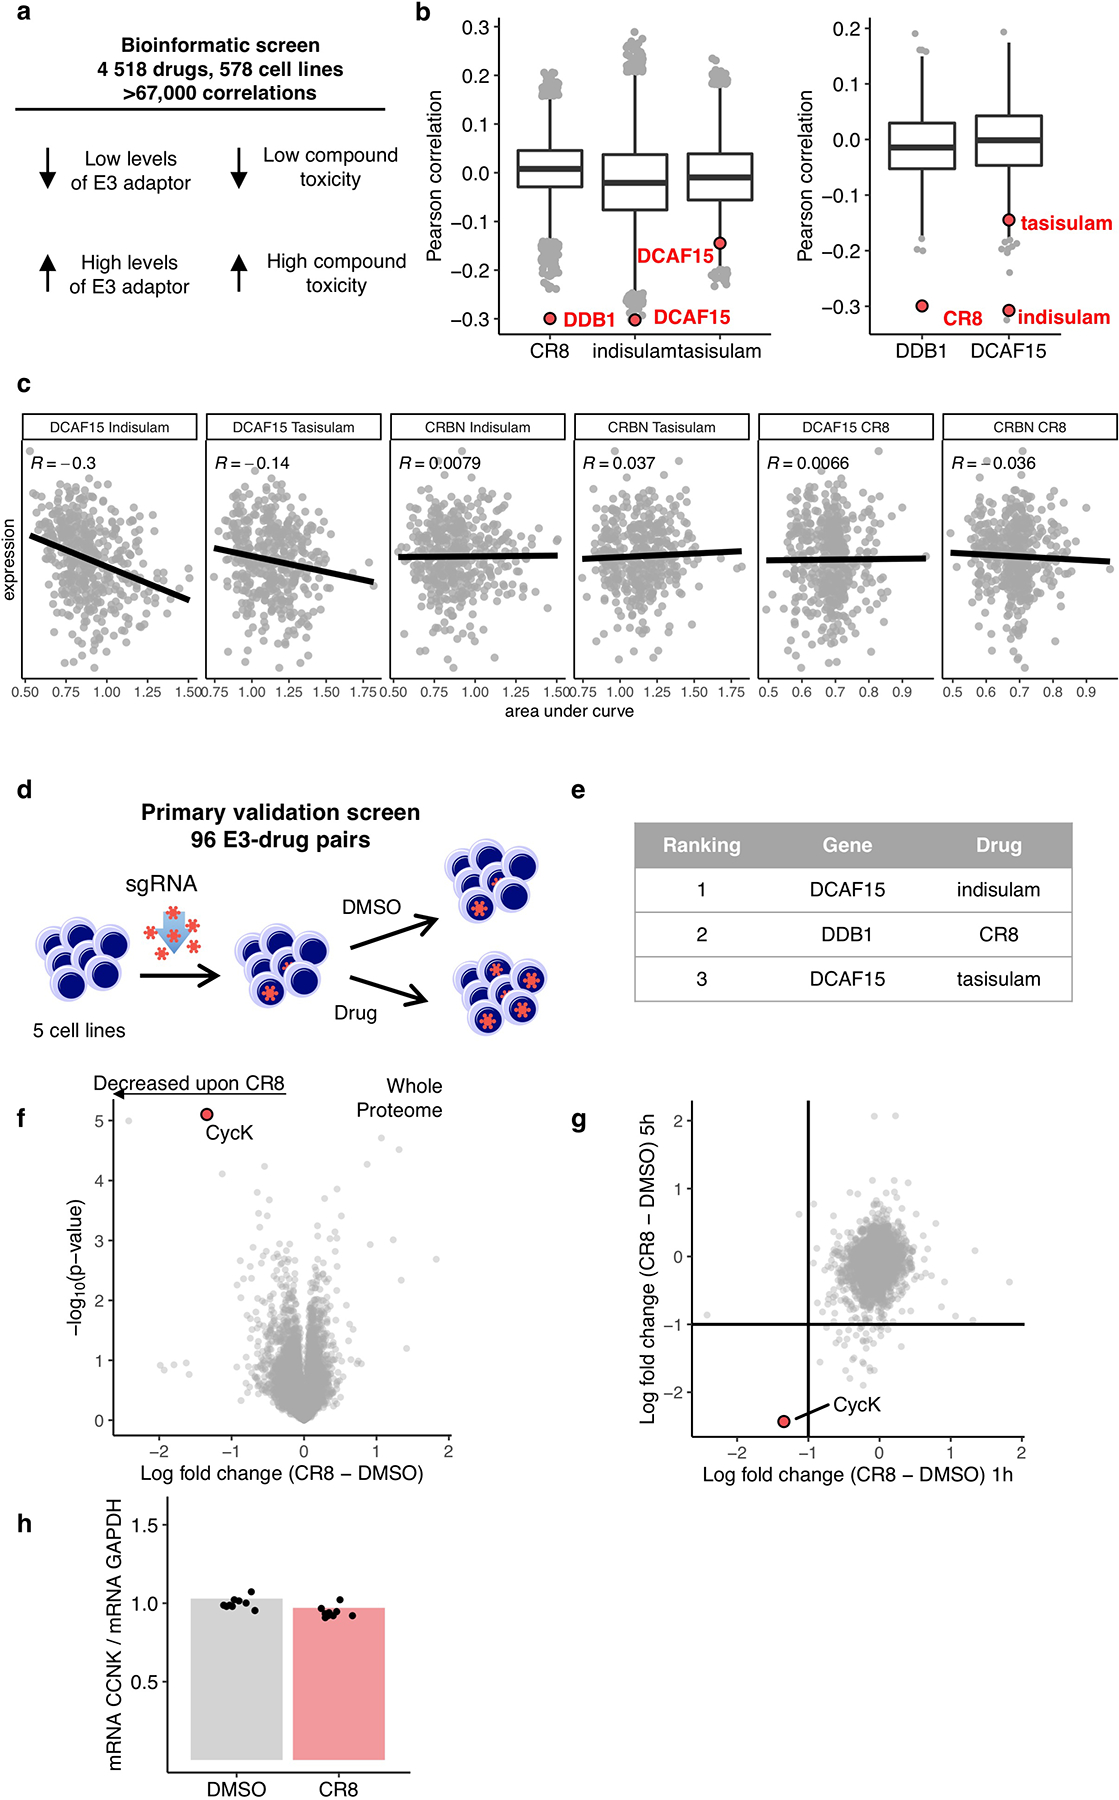
a, Schematic of bioinformatic screen for drug-E3 pairs. b, Box plot (centre, median; box, interquartile range (IQR); whiskers, 1.5 × IQR; outliers, points) for expression–sensitivity correlations (CR8 n=19110; indisulam, tasisulam n= 19109, DDB1, DCAF15 n=1618). c, Example Pearson correlation of selected drug-E3 pairs: positive controls (Indisulam-DCAF15; Tasisualm-DCAF15) and no correlation controls (others), (Indisulam n=452, Tasisulam n=418, CR8 n=471) d, Schematic of flow-based primary validation screen. e, Top three hits from the primary validation screen in 5 cell lines, performed according to the schematic in d. f, Whole proteome quantification of Molt-4 cells treated with 1 μM CR8 (n=1) or DMSO (n=3) for 1 hour (two-sided moderated t-test, n=3). g, The log2 fold changes in whole proteome quantification after 1 and 5 hours of exposure to CR8 plotted against each other. h, mRNA levels quantified by qPCR in HEK293TCas9 cells following 1 μM CR8 for 2 hours. Bars represent the mean (n=9).