
Extended Data Figure 4 |. Characterization of DDB1-CDK12-cycK complex formation.
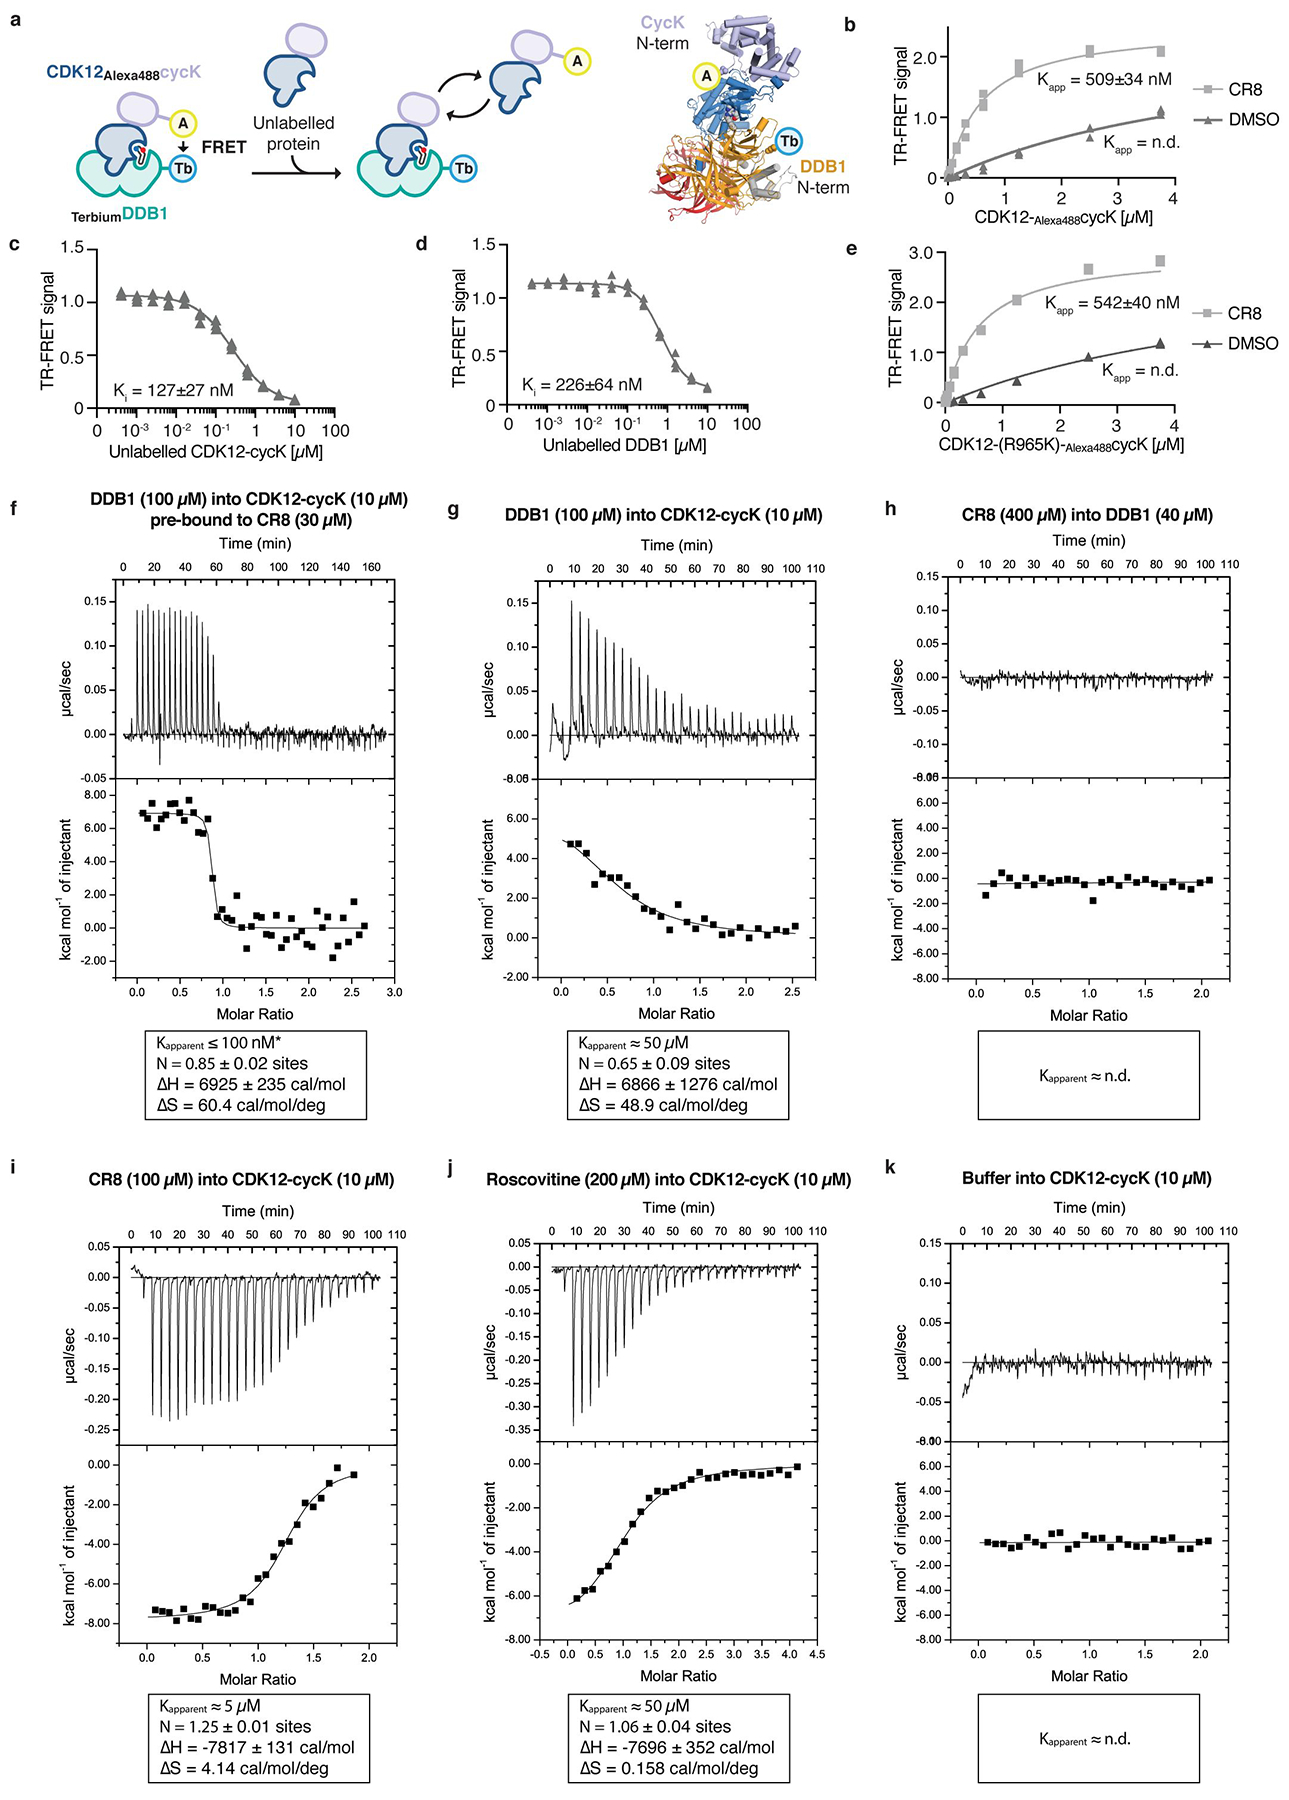
a, Schematic of the TR-FRET setup. Positions of the FRET donor (terbium-streptavidin (Tb)) and acceptor (Alexa488SpyCatcher (A)) are indicated in the structural model. b, Titration of CDK12-Alexa488cycK (0–3.75 μM) to 50 nM terbiumDDB1 and 5 μM CR8 or DMSO (n=3). c, Counter-titration of unlabelled wild-type CDK12-cycK (0–10 μM) to 50 nM terbiumDDB1, 500 nM CDK12-Alexa488cycK and 12.5 μM CR8 (n=3). d, Counter-titration of unlabelled wild-type DDB1 (0–10 μM) to 50 nM terbiumDDB1, 500 nM CDK12-Alexa488cycK and 1 μM CR8 (n=3). e, Titration of CDK12(R965K)-Alexa488cycK (wild-type sequence of canonical isoform of CDK12; 0–3.75 μM) to 50 nM terbiumDDB1 and 5 μM CR8 or DMSO (n=3). The CDK12 K965R variant, which was used throughout our in vitro studies (see Methods), shows a binding affinity indistinguishable from that of wild-type CDK12 (residue distal from the interface with DDB1 and cycK). f, Isothermal titration calorimetry (ITC) experiment (n=2, additional replicates for this and following panels are provided in Supplementary ITC Data). Specifications of the titration are given in the panel. Asterisk marking the approximate Kapparent value denotes that the binding affinity was too high to allow confident fitting of the binding curve. g, ITC experiment as in f (n=2). h, ITC experiment as in f (n=1). i, ITC experiment as in f (n=3). j, ITC experiment as in f (n=3). k, ITC experiment as in f (n=1).