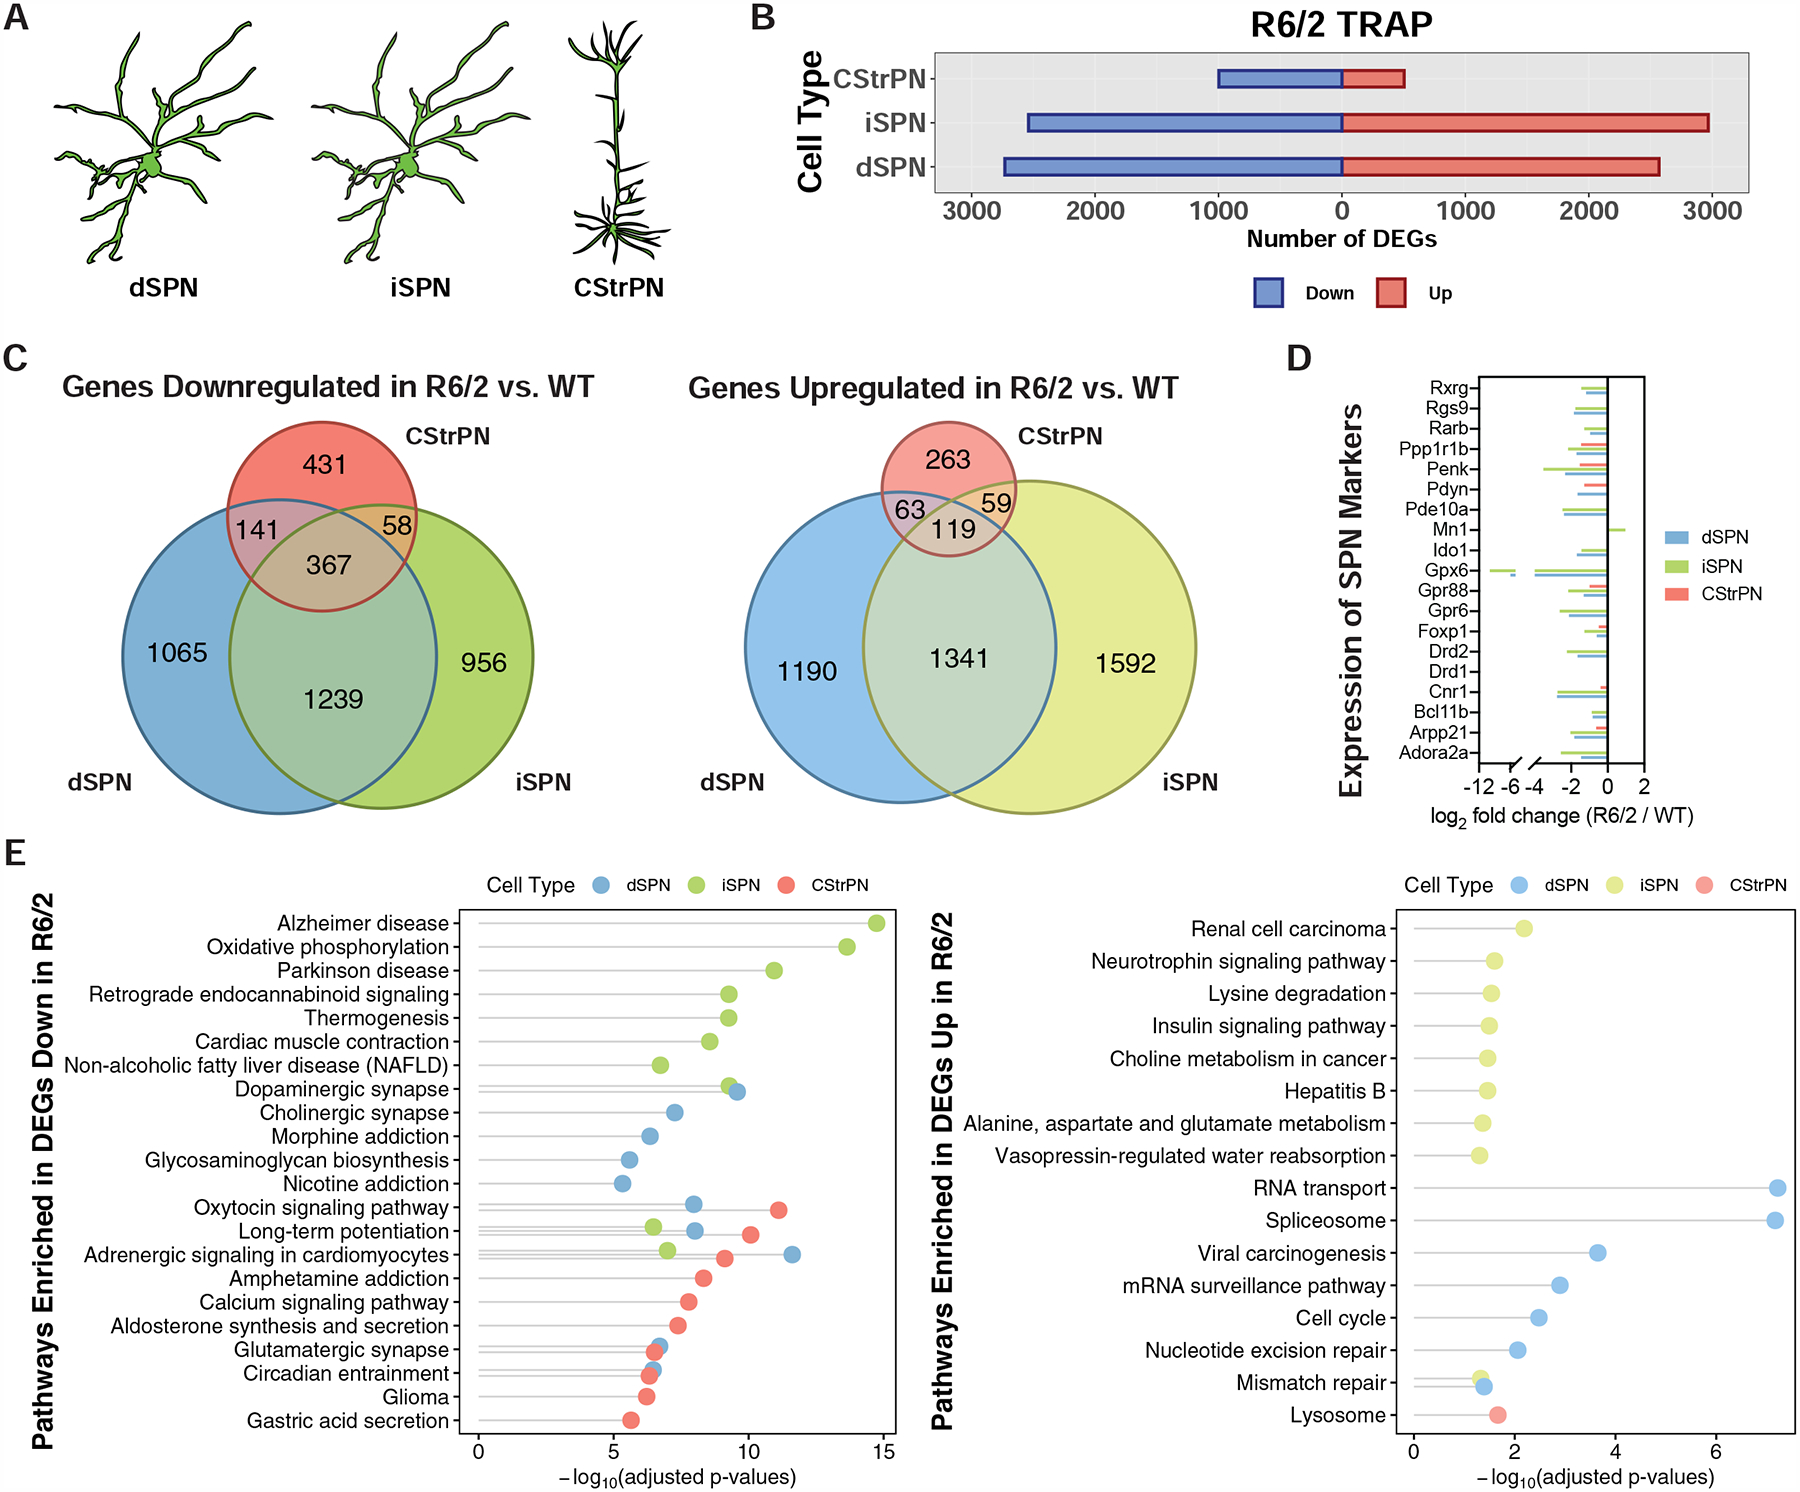
Figure 2. Cell type-specific analysis of gene expression changes in striatal spiny projection neurons (SPNs) and corticostriatal projection neurons (CStrPNs) of the R6/2 model of HD by TRAP.

(A) Schematic depicting the targeting of striatal dSPNs, striatal iSPNs, and cortical CStrPNs. (B) Number of genes that were differentially expressed at the translated mRNA level in dSPNs, iSPNs, and CStrPNs in the R6/2 model at 9-weeks of age. (C) Venn diagrams representing unique and common differentially expressed genes across the three cell types (left panel: downregulated genes; right panel: upregulated genes). (D) Plot showing downregulation of SPN marker genes in the dSPN, iSPN, and CStrPN TRAP data. (E) Enriched KEGG pathways of genes downregulated (left panel) and upregulated (right panel) across the three cell types, represented with Fisher’s exact test −log10-adjusted p-value.
