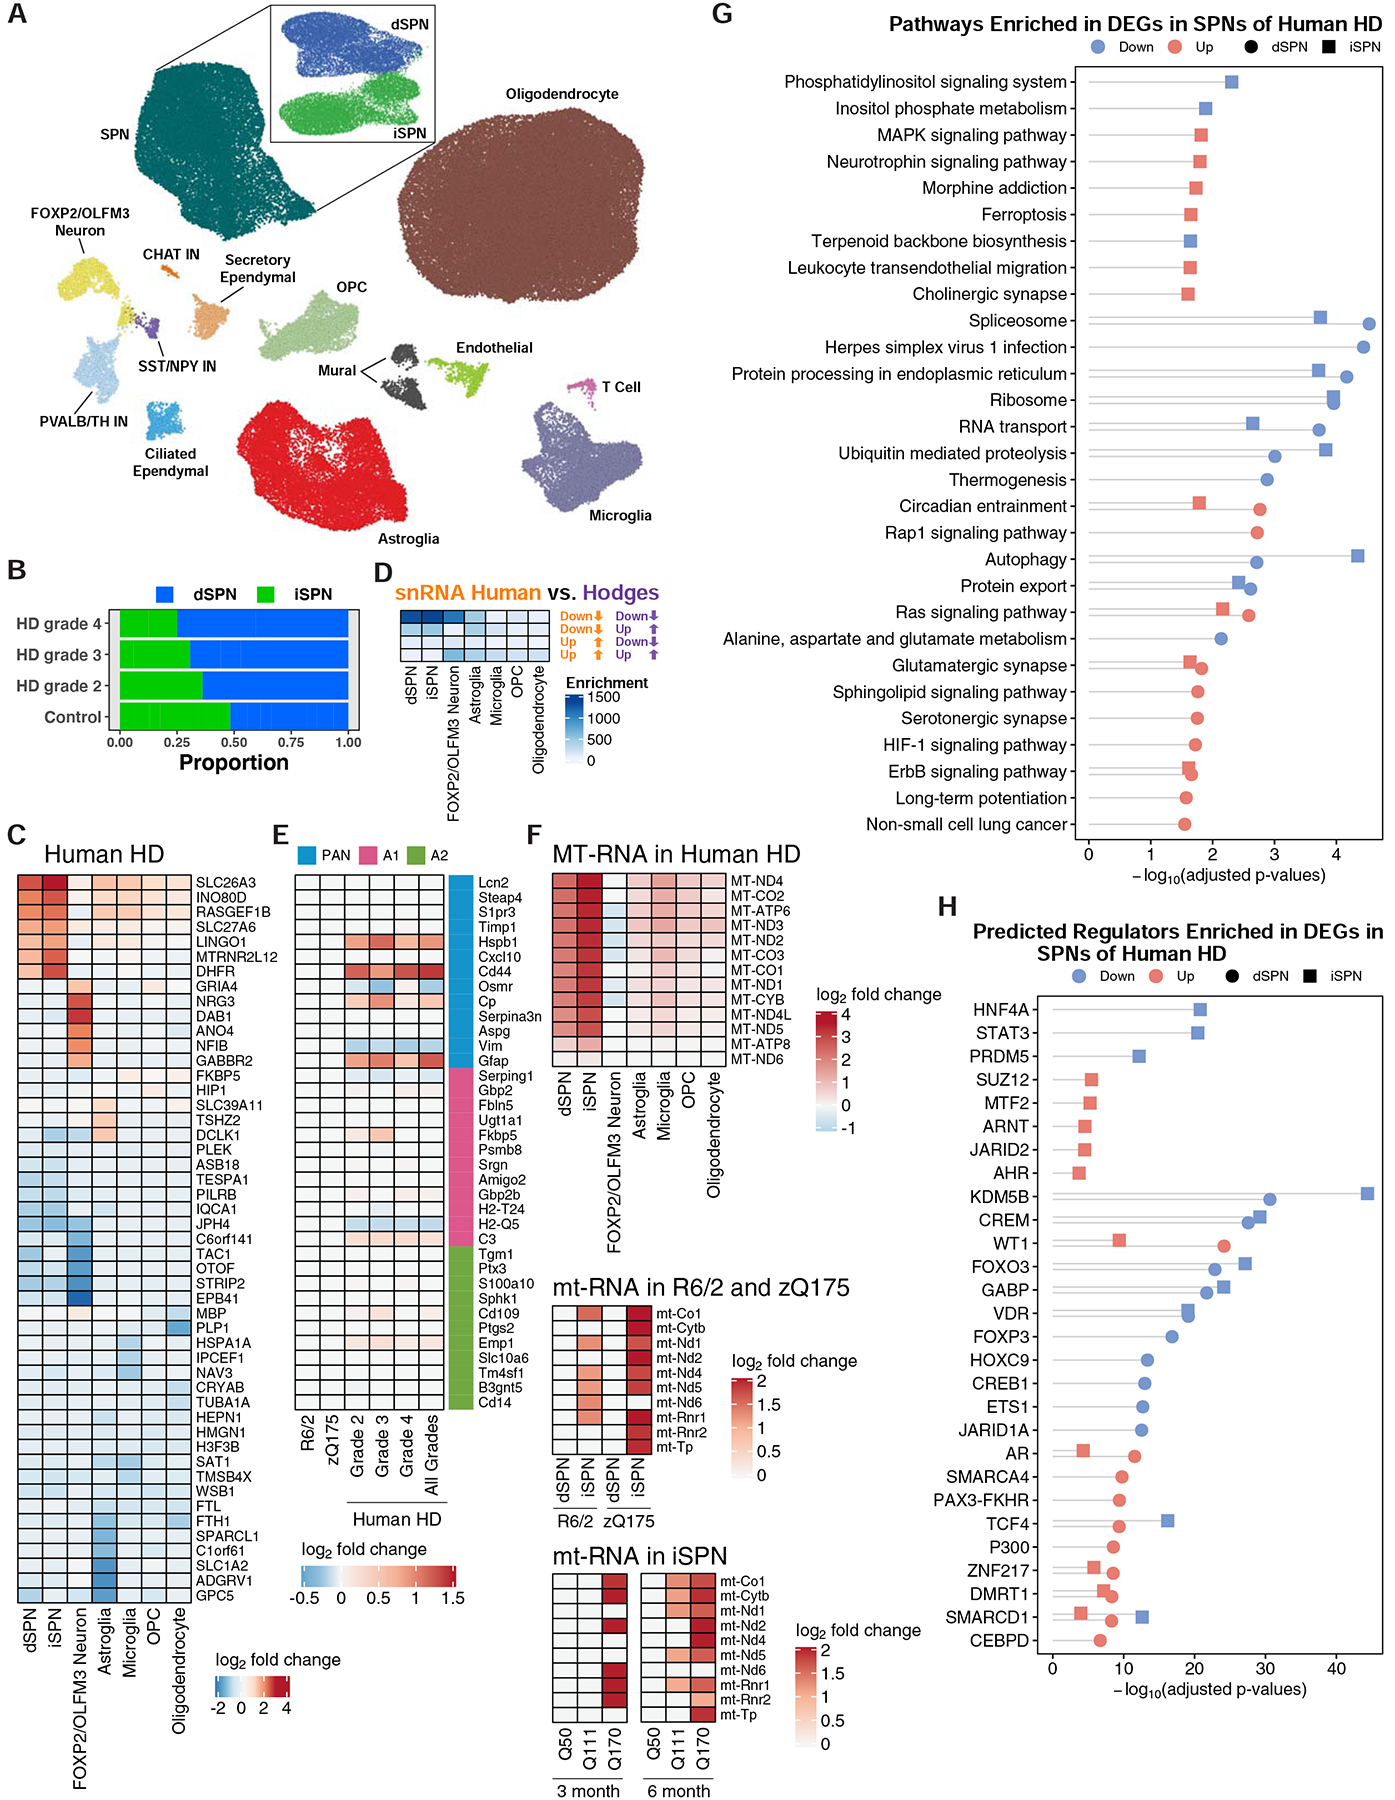
Figure 5. Cell type-specific analysis of gene expression changes in caudate and putamen cell types in control and HD post-mortem tissue by single nuclear RNA-Sequencing (snRNA-Seq).

(A) Two-dimensional ACTIONet graphs of the recovered cell types in control and HD samples (n = 125,467 nuclei across fourteen unaffected control and fourteen HD caudate and putamen samples, samples described in Table S2). Subpanel: subACTIONet graph of SPN subtypes. (B) Average fraction of dSPNs vs. iSPNs across grades of HD relative to control samples. (C) Top five most downregulated and upregulated protein-coding genes by log2-fold change in the most abundant striatal cell types. (D) Significance of overlap between downregulated and upregulated genes identified by this snRNA-Seq study to total striatal data from the cited Hodges et al. study (Fisher’s exact test and −log10-adjusted p-values). (E) Differential expression of reactive astroglia marker genes in astroglia across grades of human HD but not mouse models of HD. (F) Upregulation of mtRNAs in major striatal cell types in human HD by snRNA-Seq and in R6/2 and zQ175DN mouse models by TRAP. D-F: Overlaps were assessed using Fisher’s exact test and −log10-adjusted p-values are reported in the heatmap. (G) KEGG pathway analysis of genes downregulated and upregulated in dSPNs and iSPNs, represented with Fisher’s exact test −log10-adjusted p-value. (H) Predicted transcriptional regulators, by ChEA analysis, of genes that were downregulated and upregulated across dSPNs and iSPNs, represented with Fisher’s exact test −log10-adjusted p-value.
