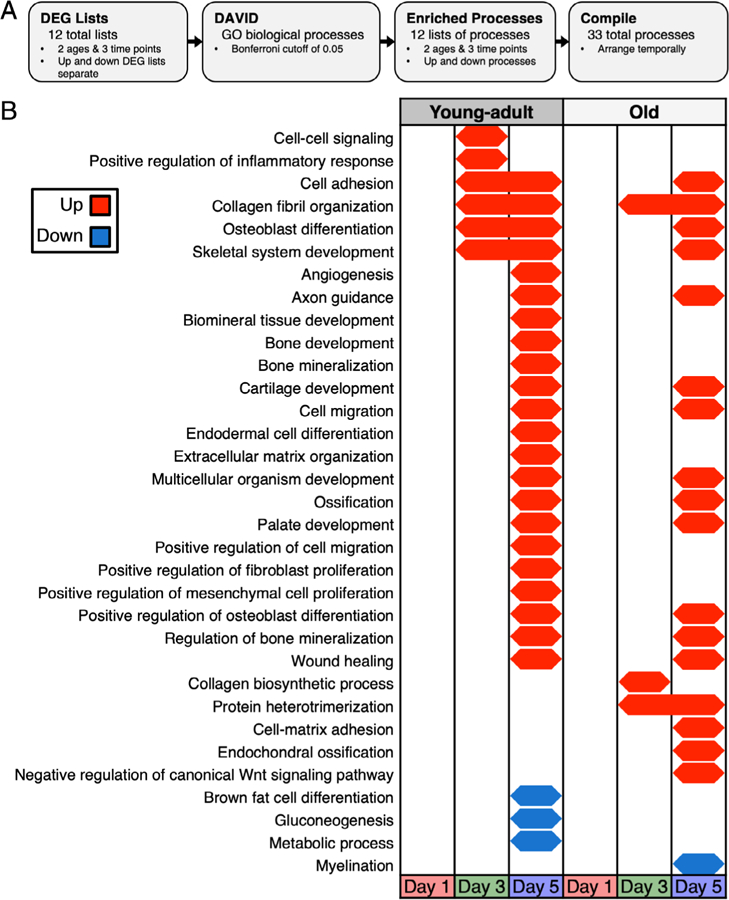
Fig. 3.

Temporal map of GO biological processes showed less activation in old mice. (A) DEG lists for each age and day combination (upregulated and downregulated DEGs separate) were input to DAVID to identify enriched GO biological processes. (B) Old mice had fewer enriched processes, and some processes were enriched later relative to young-adult mice. Young, but not old mice, downregulated metabolic processes at day 5. DEG = differentially expressed gene; GO = gene ontology.
