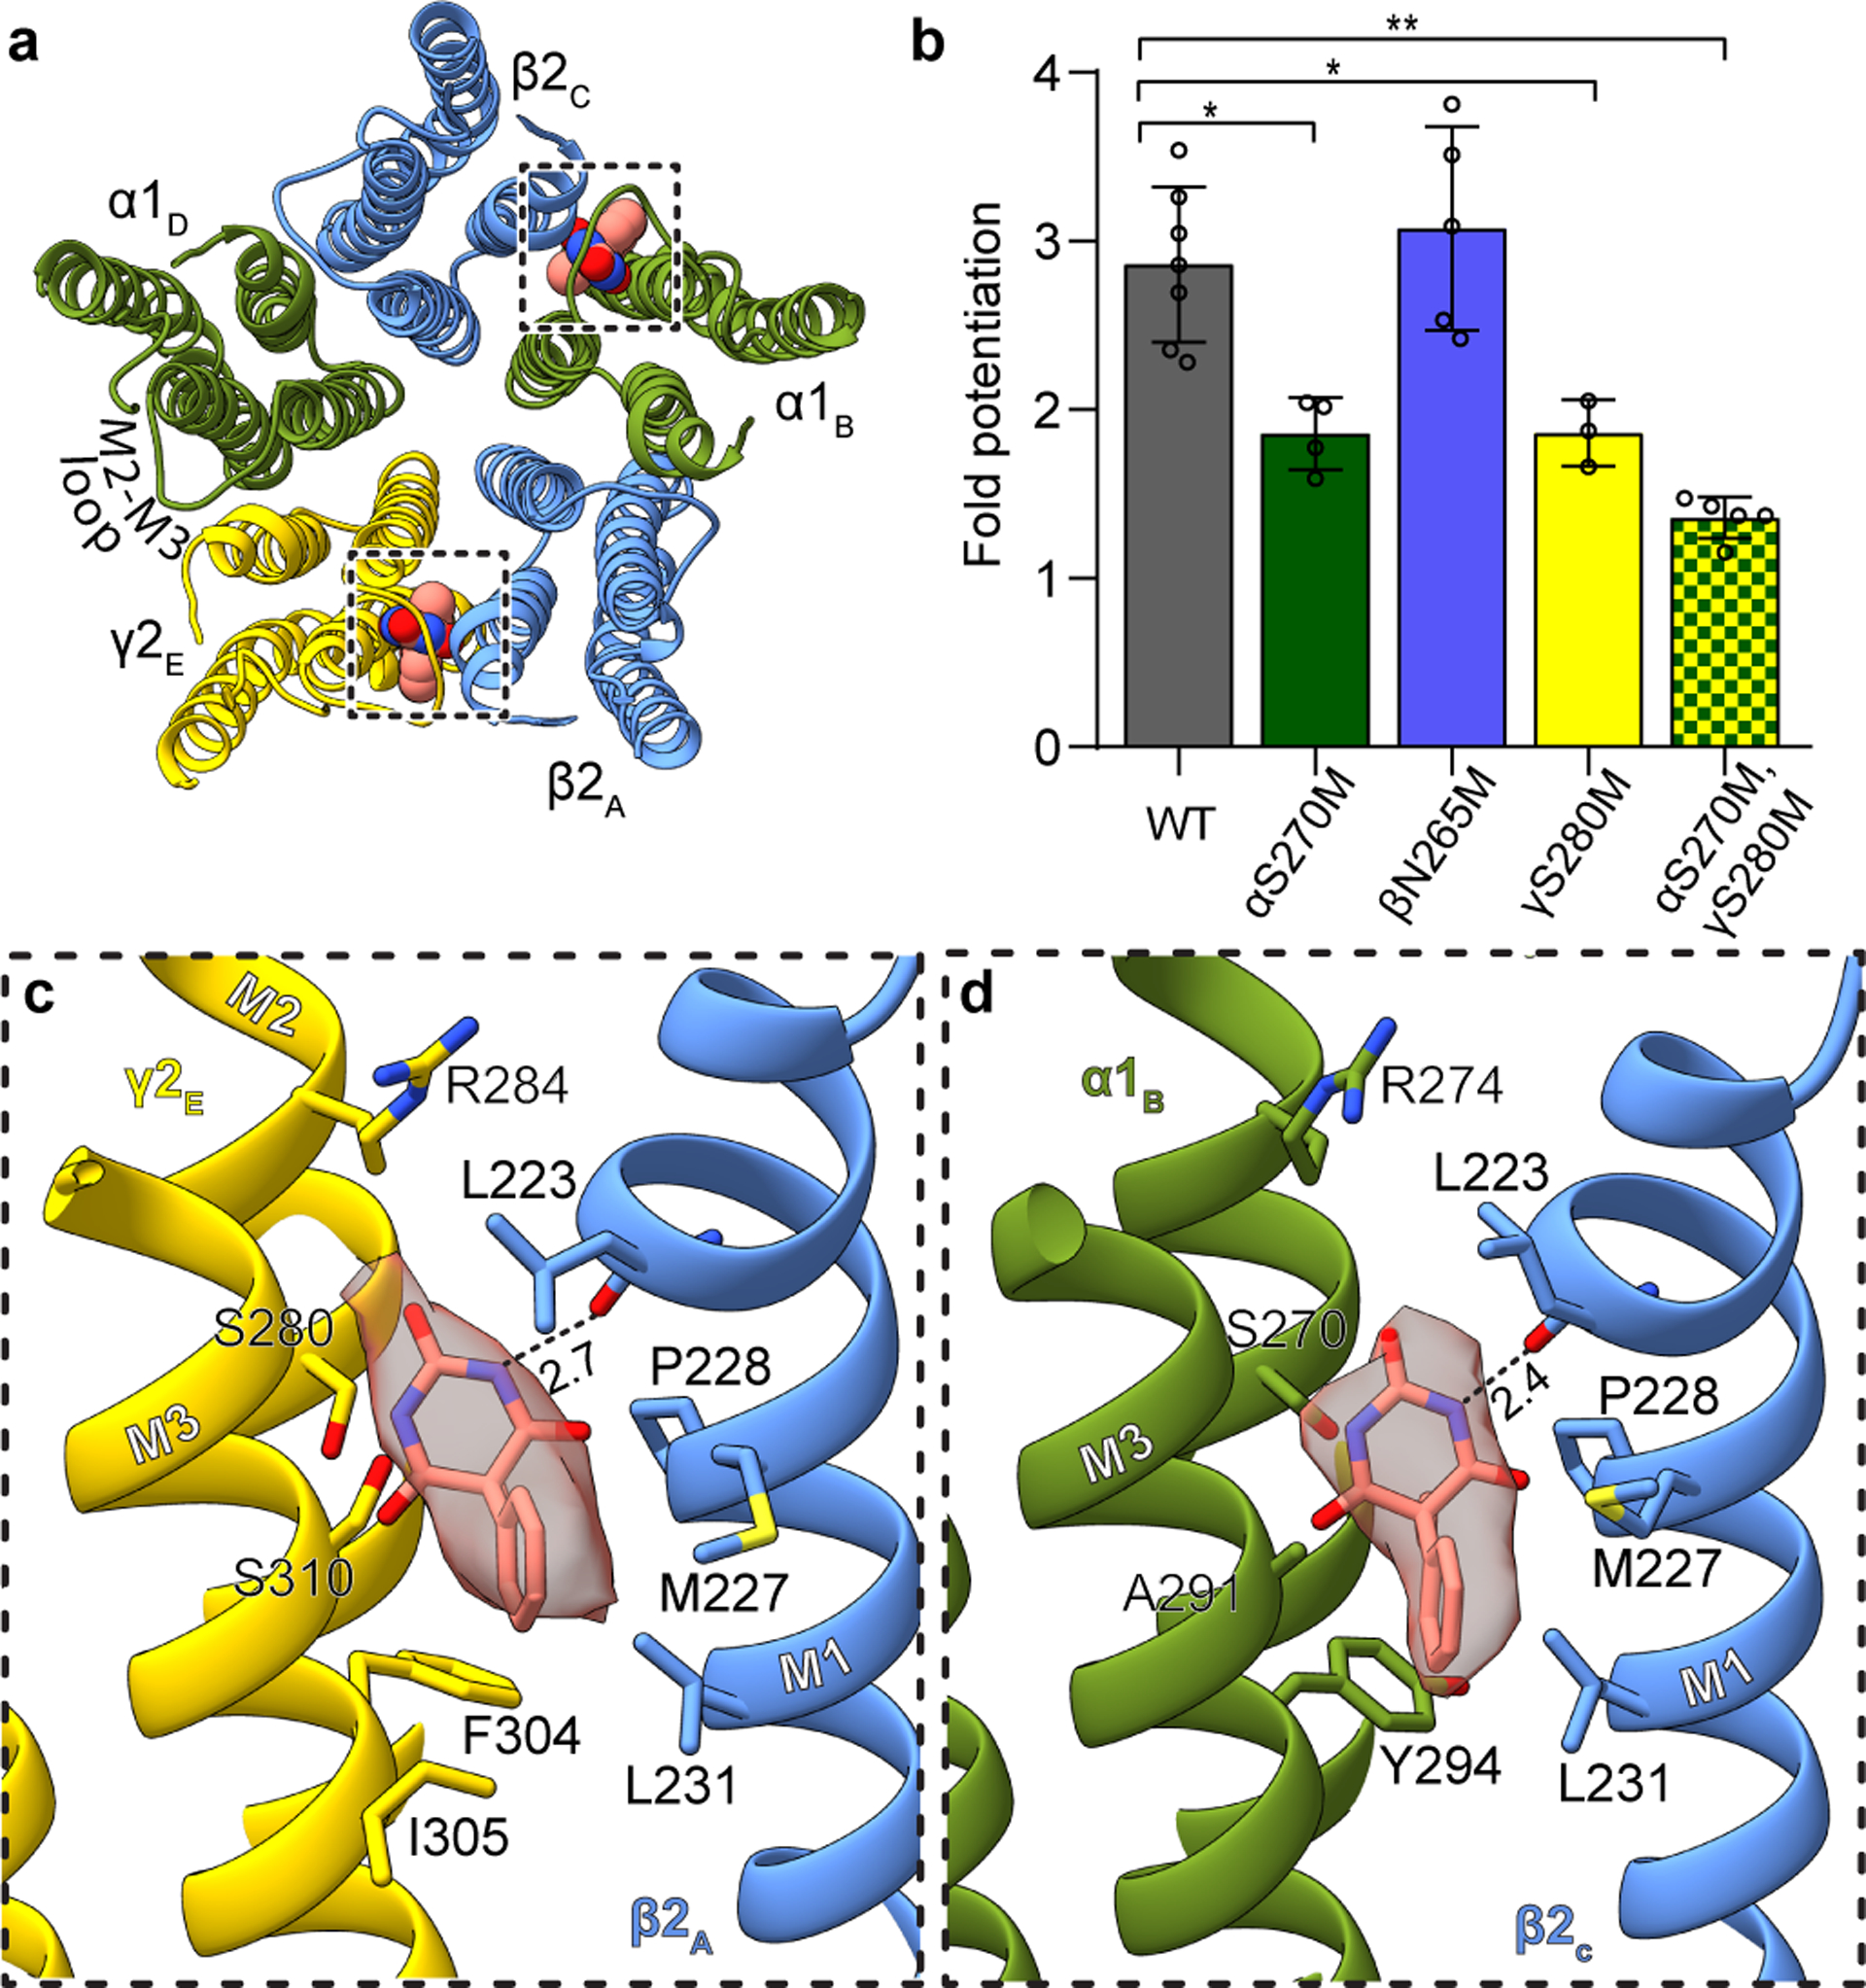
Figure 1: Phenobarbital binding sites.

Panel a provides overview of atomic model of TMD viewed down channel axis from synaptic perspective; boxes highlight phenobarbital sites with ligand shown as spheres. Panel b shows the effect of mutation at the 15’ position of different subunits on fold potentiation of GABA activation by phenobarbital. The bars indicate mean ± SD, n = 7 (WT), 4 (αS270M), 5 (βN265M), 3 (γS280M) and 5 (double mutant) *, p < 0.01 ; ** p < 0.0001. “n=X” represents biologically independent patch clamp experiments with individual cells. Panels c and d show binding site details for phenobarbital at γ-β and α-β interfaces. H-bonds indicated with dashed line and distance.
