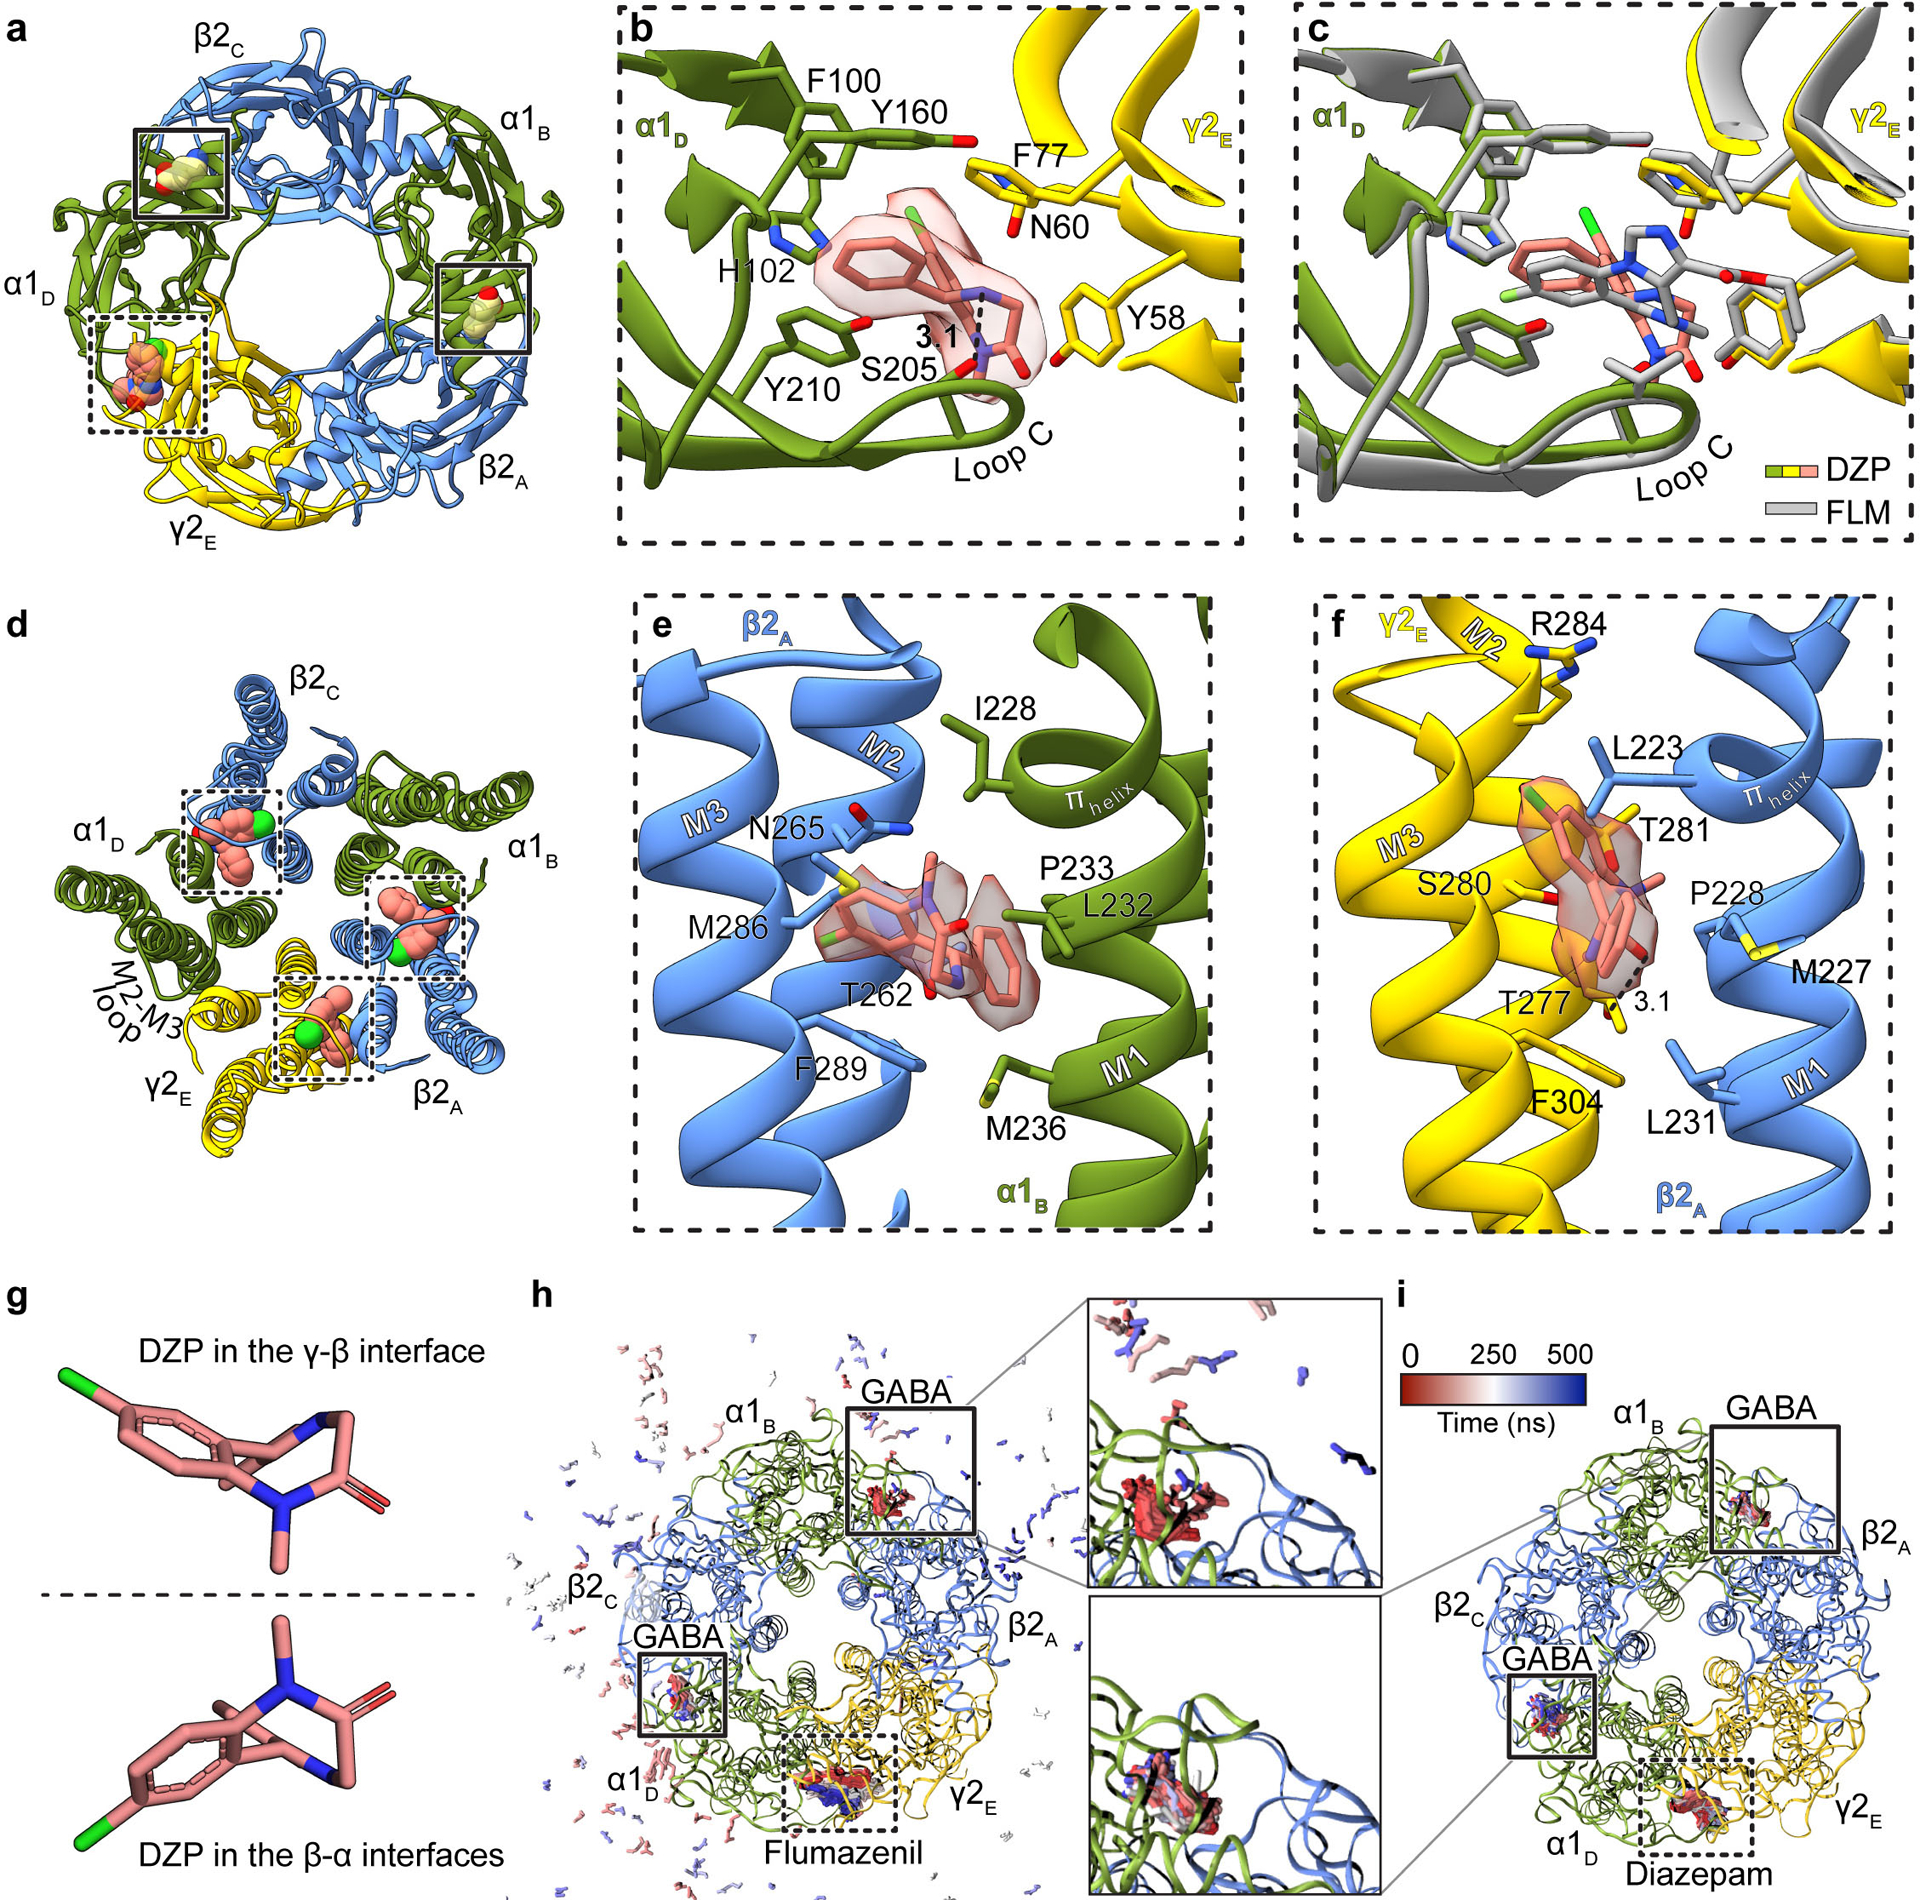
Extended Data Figure 7: Agonist and benzodiazepine complexes.

Panels a-c focus on ECD binding sites viewed from synaptic perspective; a, Overview of the diazepam complex. Panel b, position of diazepam with ligand map quality shown; side chains shown for residues contacting diazepam. Panel c, superposition of flumazenil and diazepam complexes. Panel d shows the three TMD sites identified for diazepam. Panels e and f show binding site details for diazepam at β-α and γ-β interfaces. The two enantiomeric conformations of diazepam identified in the TMD sites are in panel g. Panels h-i show snapshots from MD simulations viewed from the extracellular side. Extracellular GABA and benzodiazepines are shown as sticks, colored by frame (red-blue scale). Panel h, flumazenil-bound simulation with GABA in the upper site unbinding within 100 ns (pink-blue peripheral sticks). Panel i, diazepam-bound simulation with GABA retained in both orthosteric sites. Subunit subscripts denote chain ID. Stick representation is shown for residues within van der Waals contact range.
