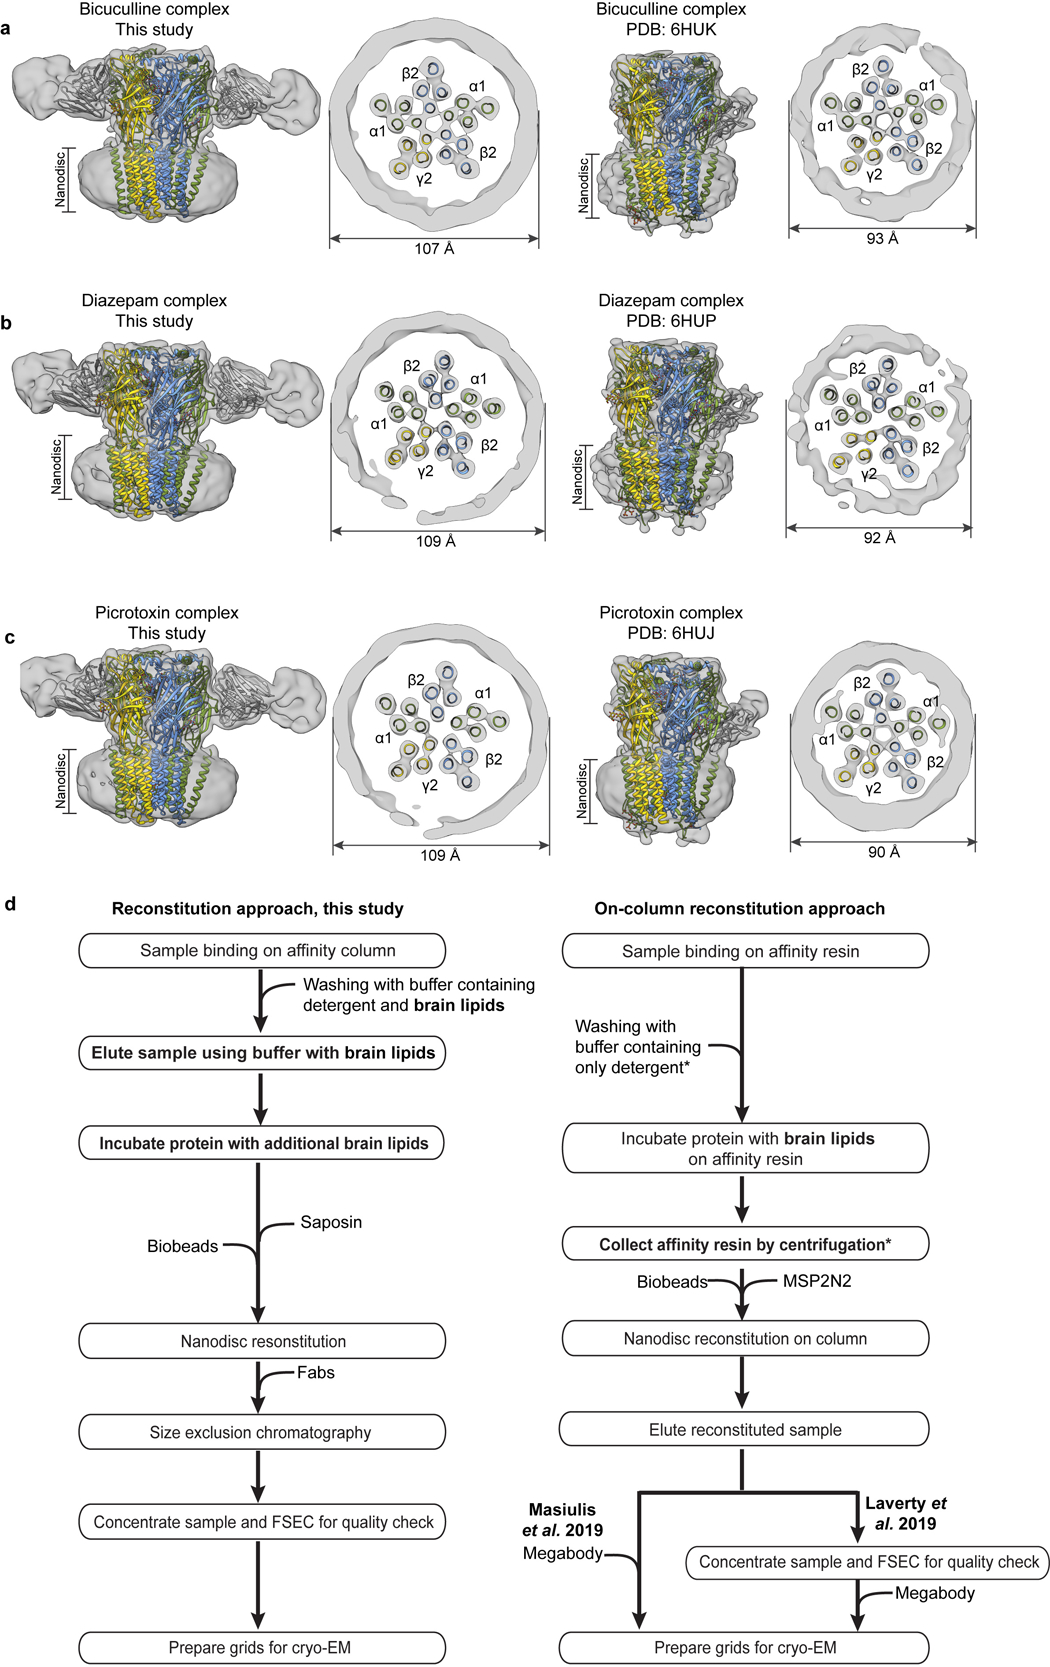
Extended Data Figure 10: Nanodisc sizes correspond to lipid ratio used in reconstitution.

Panels a-c compare experimental EM maps (with docked structures), low-pass filtered to 10 Å resolution, between matched α1β2γ2 and α1β3γ2 ligand complexes. Panel d compares the reconstitution approach from the current study with the on-column approach used to obtain the α1β3γ2 receptor structures18,19. Asterisks indicate steps we hypothesize give rise to the observed different nanodisc sizes: washing with lipid-free detergent buffer removes lipids, and the step of collecting affinity resin by centrifugation removes excess lipids, such that when the MSP2N2 scaffold and biobeads are added, there are no extra lipids to fill the large scaffold.
