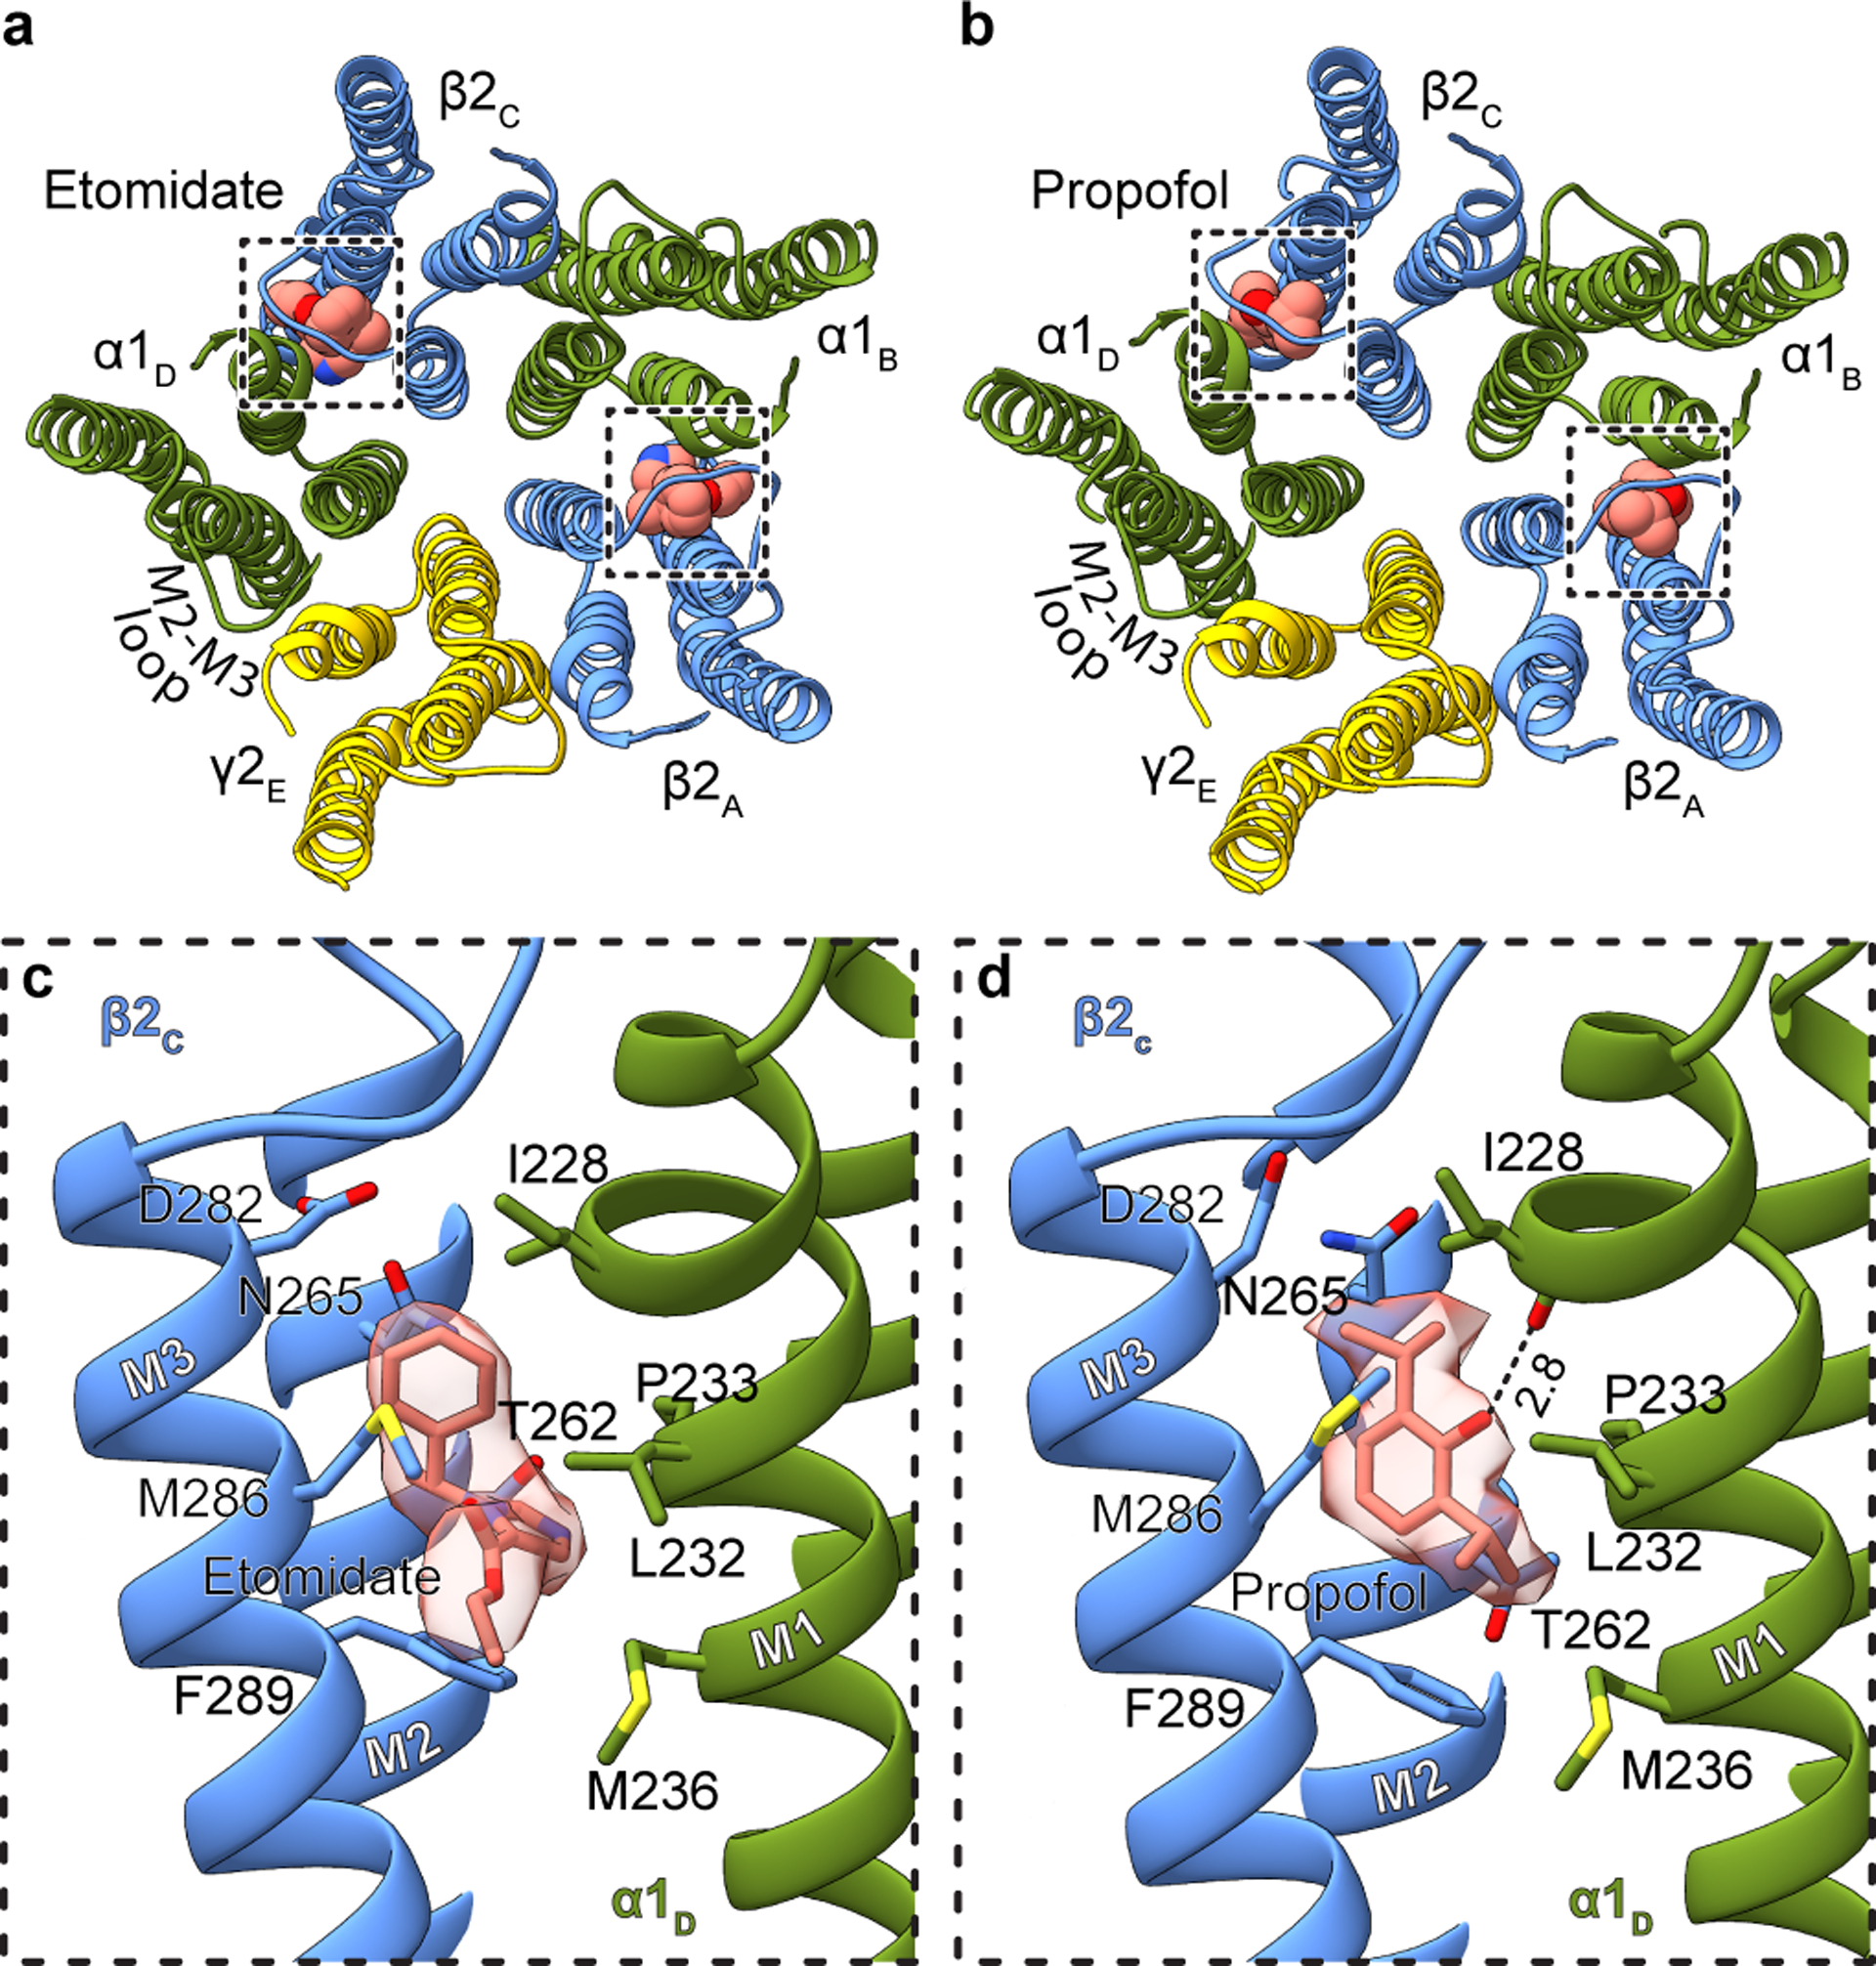
Figure 2: Etomidate and propofol interactions.

Panels a and b show atomic model overview of the TMD sites for etomidate and propofol, respectively; ligands are shown as spheres. Subunit subscripts denote chain ID. Panels c and d show binding site details for one of the two equivalent β-α sites for each ligand. Experimental density for ligands is shown as semi-transparent surface.
