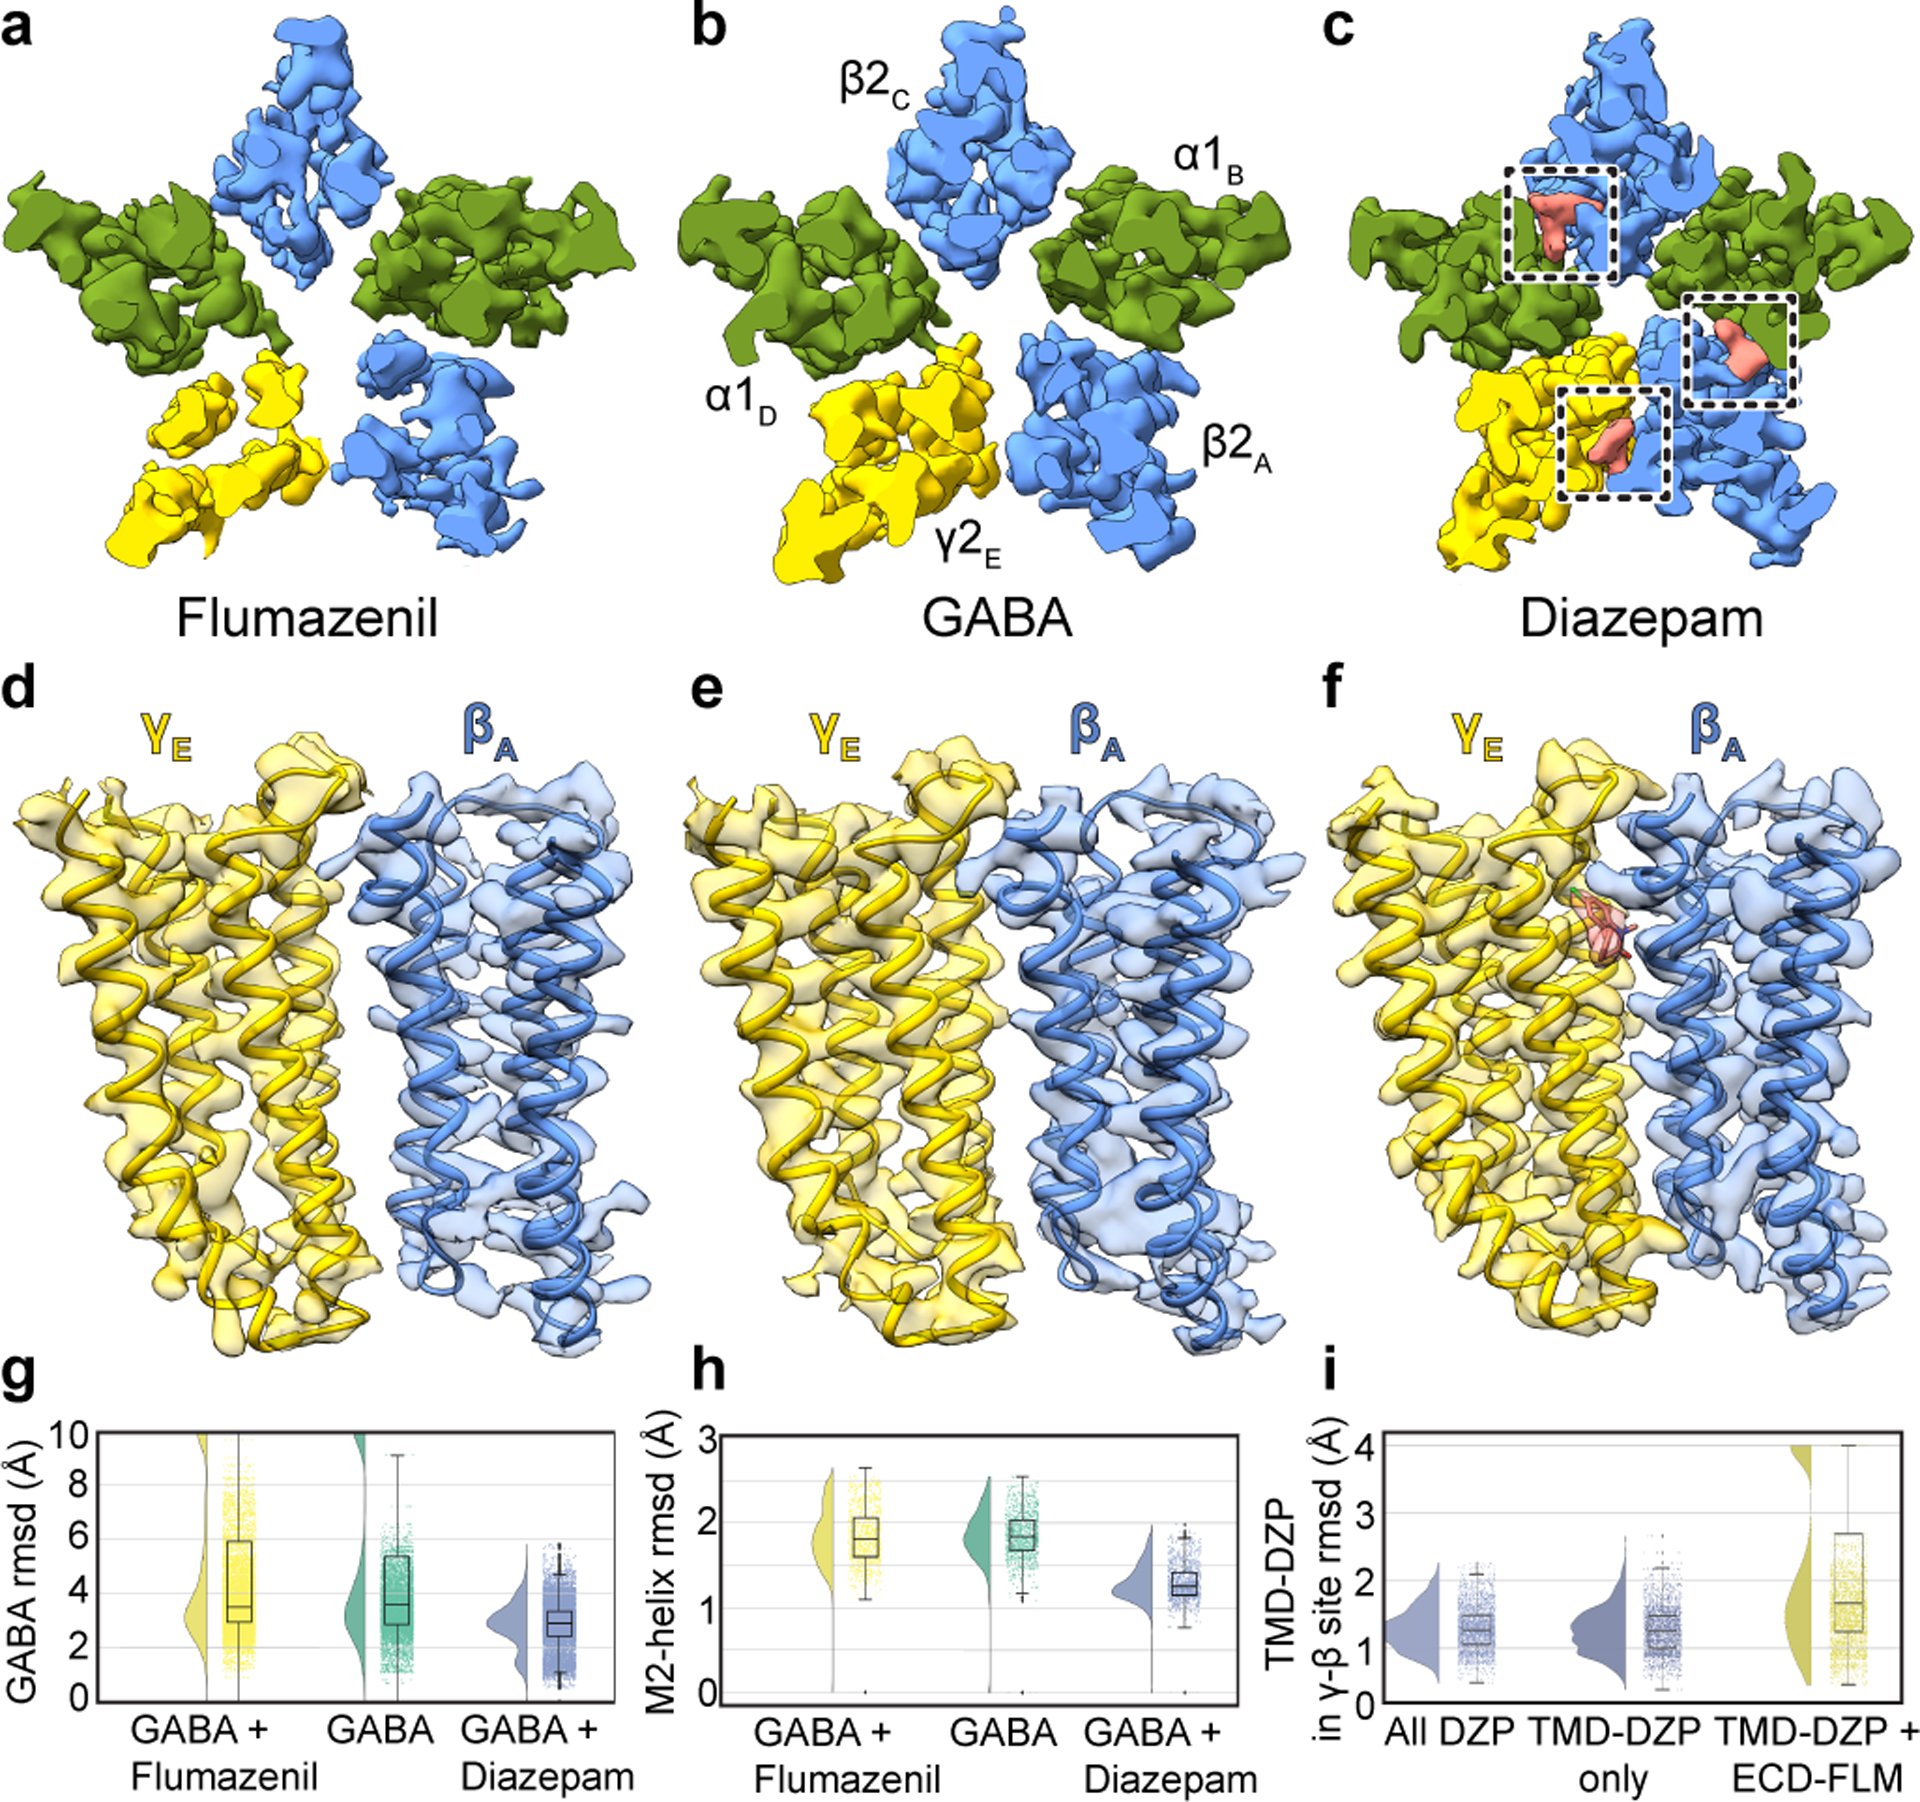
Figure 3. Benzodiazepine sites and mechanism.

Panels a-c show z-slices in the TMD of cryo-EM density maps for the three complexes; boxes in c highlight diazepam (salmon) TMD sites. Panels d-f show map and model in TMD at the γ-β interface to illustrate large interfacial gap in flumazenil complex, smaller gap in GABA alone complex, and absence of a gap in diazepam complex. Panels g-i show stability (rmsd, Å) in benzodiazepine-related simulations, with probability distribution at left, and raw data (n = 500 samples from 4 simulations, see Methods) plus boxplots indicating median, interquartile (25th-75th percentiles) and minimum–maximum ranges at right. Panel g, diazepam-bound simulations (blue) exhibit stabilization of GABA over both orthosteric sites relative to flumazenil-bound (yellow) or GABA-alone (green) conditions. Panel h, stabilization of M2 helices in the presence of diazepam. Panel i, destabilization of the transmembrane γ-β interface in the presence of extracellular flumazenil, relative to either diazepam or no ligand at the extracellular α-γ interface.
