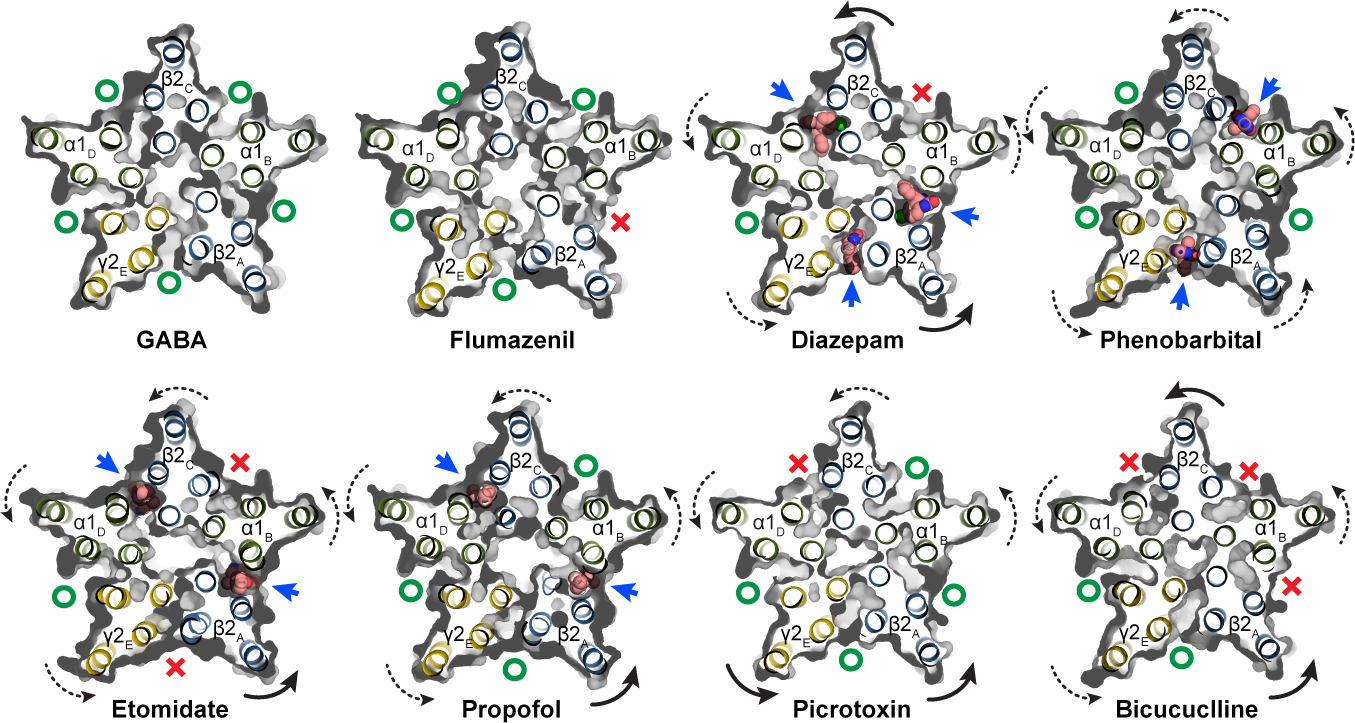
Figure 4: Anesthetic cavity selectivity and conformation.

Models and molecular surfaces are shown from a perspective down the channel axis, at the level of the TMD binding sites identified for diazepam, phenobarbital, etomidate and propofol. Straight arrows indicate occupied binding sites with ligands shown as spheres. Curved arrows indicate rigid body subunit transformations relative to the GABA alone structure (dashed lines are minor; solid lines are major rotations/translations). Green “O’s” indicate open or partially open cavities; red “X’s” indicate closed-off cavities.
