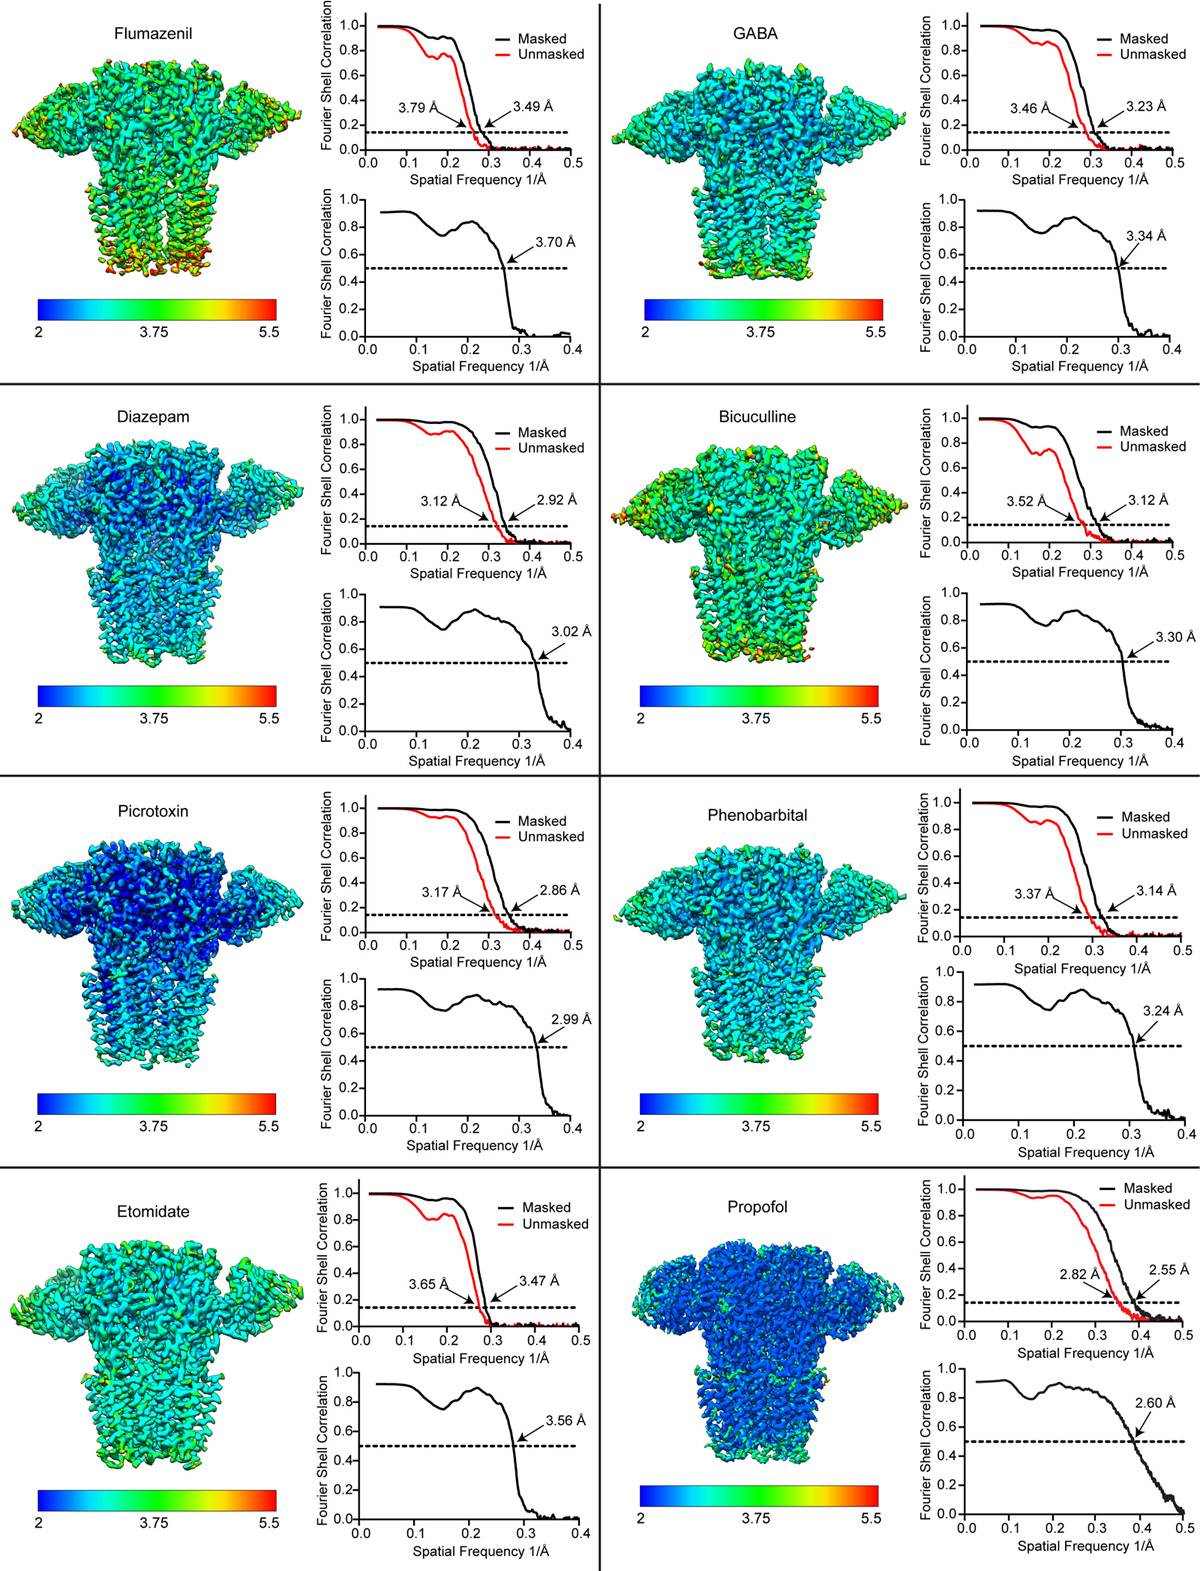
Extended Data Figure 3: Overall and local map resolution and global map-model agreement.

For each structure, the sharpened map is colored by local resolution, and map FSC (upper right) and map-model FSC (lower right) plots are shown. For the flumazenil complex, two maps were used in building, a higher resolution map that had weak γ-TMD density, and a lower resolution map with strong γ-TMD signal. Shown here for this structure is the lower resolution map with strong signal for the whole receptor. Both maps will be deposited for this flumazenil complex, and relevant statistics for these maps are shown in Extended Data Tables 1, 2.
