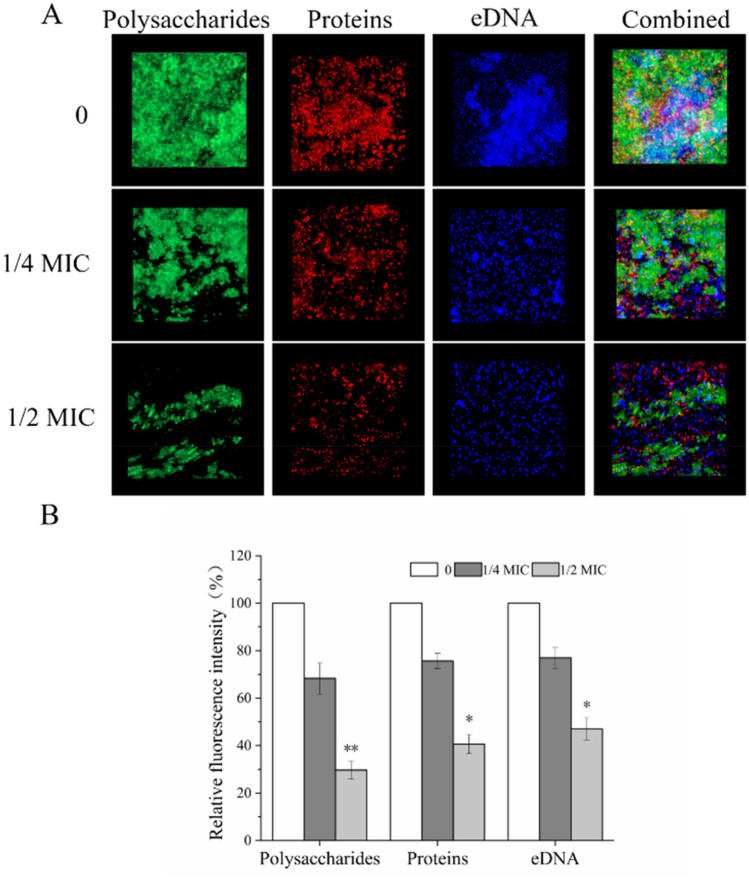
Fig. 6.
CLSM images of biofilm composition (scale bar: 10 μm). Three fluorescent markers (SYPRO Ruby, WGA, and DAPI) were used to stain proteins, carbohydrates and eDNA of biofilm matrices, respectively. a CLSM images were examined at 63 × magnification. b The relative fluorescence intensity of each treatment group was calculated and plotted against that in untreated group using KS 400 version 3.0 software. Bars represent the standard deviation (N = 6), **P < 0.01; *** p < 0.001

