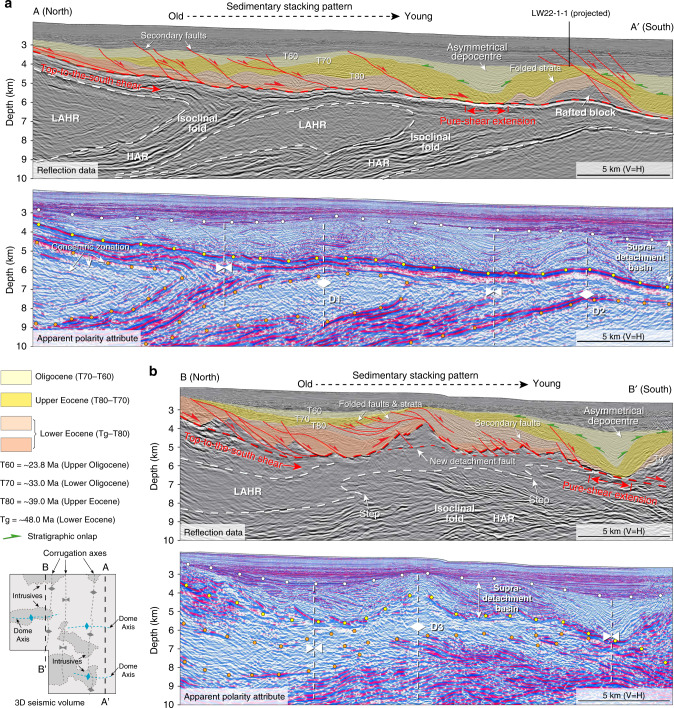
Fig. 3. Interpretation of reflection data and apparent polarity attribute parallel to the dip of the Liwan detachment fault.
a Seismic section on the eastern side of the study area; b seismic section on the western side of the study area. Note that both seismic sections show the detachment fault geometry, stratigraphic architecture of the supradetachment basin, and subdetachment deformation in the southern flank of the large dome in Fig. 1b. See Fig. 2 for sections location and the sub-domes (D1, D2, D3). The white circles denote the upper boundary of the supradetachment basin. The yellow circles delineate reflections from the Liwan detachment fault. The brown circles mark the boundary of low-amplitude homogeneous and layered high-amplitude reflections. The white vertical dashed lines represent fold axes. The southeastward younging of Eocene sediments suggest top-to-the-south shear associated with detachment faulting. The asymmetrical depocentre is defined by the onlaps (green arrows) on the flanks. It may indicate pure-shear extension in the south of the detachment fault, which occurred simultaneously with the upwelling of D1, D2, and D3 and developed between T70 and T60 (Oligocene). LAHR low-amplitude homogeneous reflection, HAR high-amplitude reflection.

