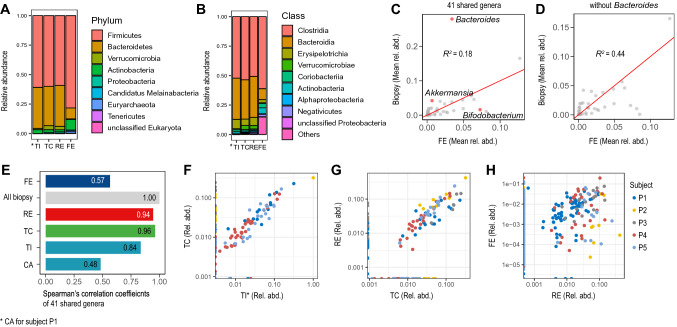
Figure 2.
Taxonomy of metagenomics species (MGSs) from terminal ileum/caecum (TI*), transverse colon (TC), rectum (RE), and faeces (FE); n = 5 for each group. (A, B) Top 10 most highly abundant phyla (A) and classes (B) in the large intestine; phyla/classes are sorted, in the legends, from the most to the least abundant in all three biopsy-locations. The corresponding faecal values are also plotted for comparison, in the same order. (C, D) Scatter-plots of mean relative abundances of all 41 genera shared by biopsies and FE (C), and of the same genera except Bacteroides (D). E Spearman’s linear correlation coefficients between all biopsies and each sampling location. (F–H) Scatter-plots of the genera relative abundances of three sample-pairs: TI* versus TC (F), TC versus RE (G), and RE versus FE (H); data points are colour-coded by subject.

