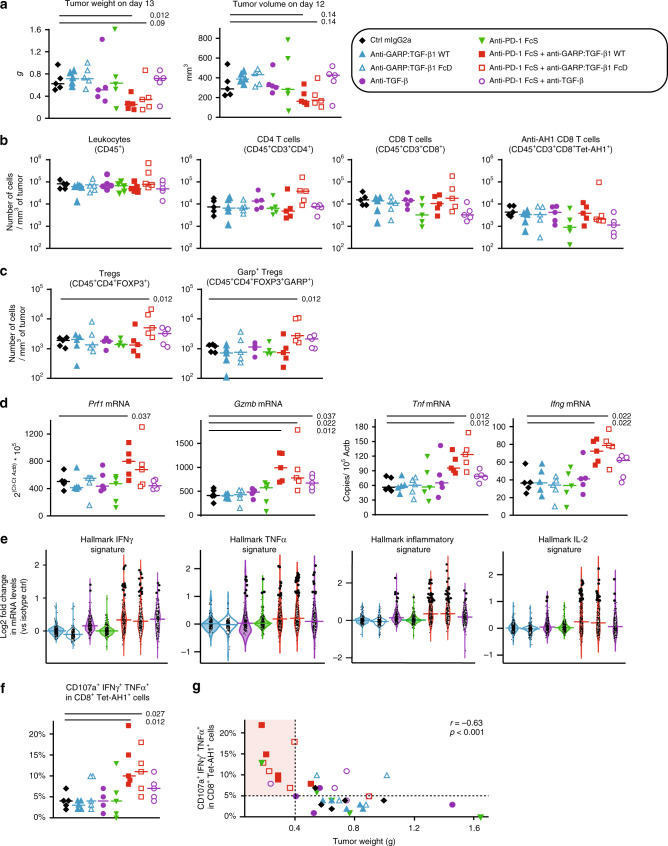
Fig. 5. Combined blockade of GARP:TGF-β1 and PD-1 increases effector functions of anti-tumor CD8+ T cells.
BALB/c mice (n = 5/group) were injected with CT26 cells on day 0 and treated with mAbs on days 6, 9, and 12, as illustrated in Fig. 2. Tumors were collected on day 13. a Weight of tumors collected after euthanasia on day 13 and volume of tumors measured the day before. Each data point represents the value measured in one mouse, and horizontal bars the median per group. b, c Numbers of various subsets of cells infiltrating 1 mm3 of tumor, as determined by flow cytometry. Data points and horizontal bars as in a. d Expression of genes as determined by RT-qPCR. Data points and horizontal bars as in a. Numbers in italics show P values < 0.05 for the comparisons with the control group (isotype ctrl mIgG2a), as calculated with a two-sided Wilcoxon test. e Violin plots representing fold change in expression of genes from hallmark signatures (MSigDB database) in each treatment group by comparison to the isotype control group, as determined by RNAseq. Within a group, each dot represents one gene of the indicated signature, with its position on the Y axis representing the ratio between mean expression in the treated versus control group. Genes with a fold change ≥2 are represented by larger dots. Horizontal bars are median fold change for all genes of the signature. Violin contours show the kernel density ditributions of fold changes. Numbers of genes in the indicated signatures: IFNγ = 179; TNFα = 184; inflammatory = 164; and IL-2 = 175. f Cells isolated from tumors were stimulated in vitro with the AH1 peptide, and analyzed by flow cytometry for surface markers and intracellular cytokines. Data points, horizontal bars, and P values as in d. g Correlation between proportions of anti-tumor CD8+ T cells displaying multiple effectors functions (shown in f) with tumor weight in the corresponding mouse at day 13. г = Pearson’s correlation coefficient with corresponding P value calculated with one-tailed F-test. Results shown here are representative of at least three independent experiments.

