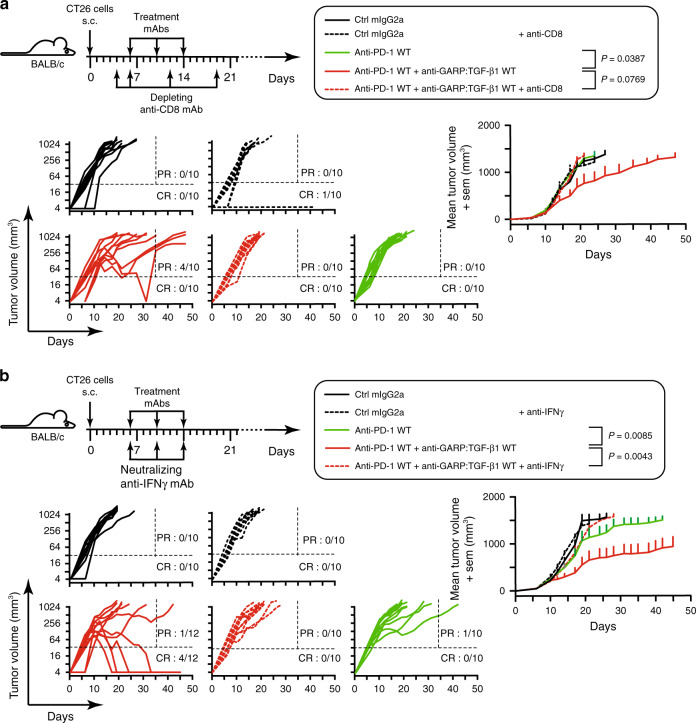
Fig. 6. Anti-tumor efficacy of combined blockade of GARP:TGF-β1 and PD-1 requires CD8+ cells and IFNγ.
a Experimental design as in Fig. 2, except that mice (n = 10–12/group) also received injections of a depleting anti-CD8 antibody at the indicated time points. Graphs on the left show evolution of tumor volumes in individual mice. Ratios indicate the proportions of CR, (mice alive at the end of the experiment with no detectable tumor) and PR (mice alive on day 35 that carry a tumor >32 mm3 at the time of euthanasia). Dotted horizontal and vertical lines indicate the two arbitrary limits (tumor volume of 32 mm3 and day 35) used to identify PR and CR. Graph on the right shows evolution of mean tumor volumes + sem in the five treatment groups. P values for relevant comparisons are indicated in the graphical legend and were calculated with a mixed effects model (Liu et al.46; Sugar et al.45), with a post-hoc Tukey’s test for multiple comparisons. b As in a, except that mice received a neutralizing anti-IFNγ.

