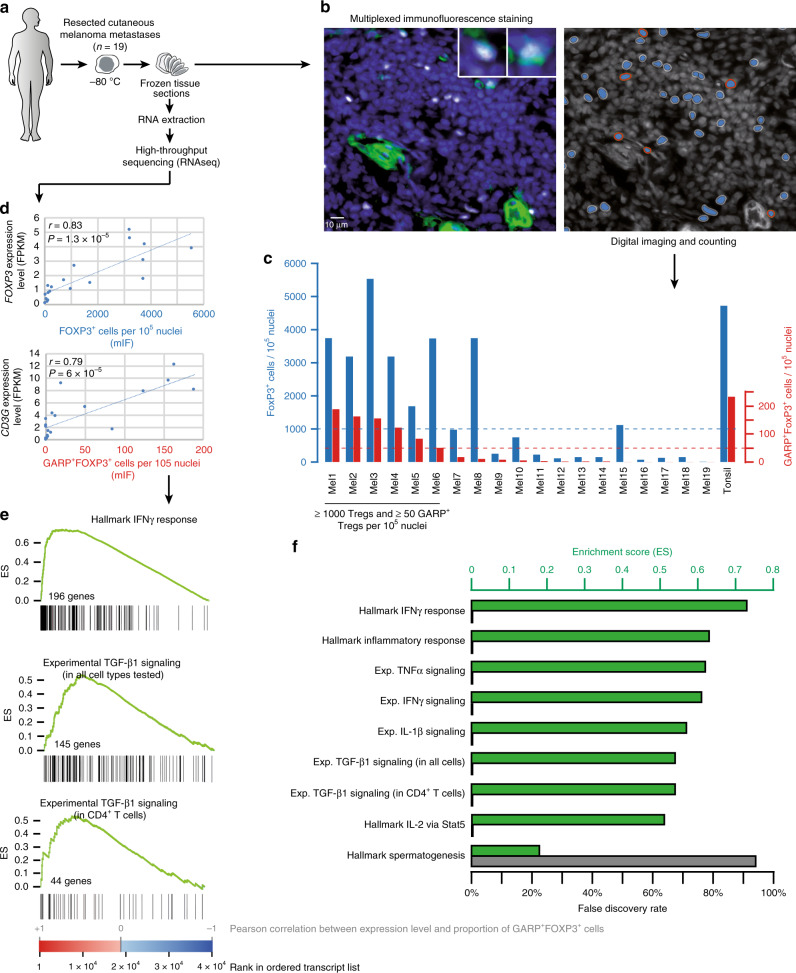
Fig. 8. Association between inflammatory gene signatures and activated Tregs in a series of 19 human melanoma metastases.
a Experimental setting. See text for details. b FOXP3 and GARP-expressing cells were stained by mIF on frozen tumor sections. Left panel: representative view from tumor sample Mel1. Nuclei appear in blue, FOXP3 in white and GARP in green. Upper right: detail of two FOXP3+GARP+ cells. Right panel: automated detection of FOXP3+GARP− (blue) and FOXP3+GARP+ cells (blue ringed red). c Diagram representing the proportion of FOXP3+ and FOXP3+GARP+ cells in each tumor sample, calculated from the automated counts of nuclei, FOXP3+ and FOXP3+GARP+ cells. d Top: graph showing the Pearson correlation between the proportion of FOXP3+ cells and the level of expression of the FOXP3 gene, obtained by RNAseq analysis of tissue sections from the same tumors. Bottom: idem with FOXP3+GARP+ cells and CD3G. Indicated P-values for Pearson correlation were calculated with a two-sided t-test e Gene set enrichment analysis (GSEA). The 38,602 transcripts measured by RNAseq were ordered by decreasing Pearson correlation between their expression level and the proportion of FOXP3+GARP+ cells in the 19 tumor samples. Black vertical bars indicate positions of genes from various gene sets in the ordered transcript list. Gene set enrichment in the ordered transcript lists are plotted as green curves, with the Enrichment Score (ES) corresponding to the maximum value. Upper panel: gene set of the hallmark IFNγ signature (MSigDB). Middle and bottom panels: gene sets induced by TGF-β1 as determined in expression microarray experiments in which human melanoma cell lines, primary endothelial cells, fibroblasts, melanocytes, or a CD4+ T cell clone were exposed to the recombinant cytokine (middle panel: genes induced by TGF-β1 in at least one of the five cells types; bottom panel: genes induced by TGF-β1 in CD4+ T cells; See also Supplementary Data 2). f ES (green rectangles) and false discovery rate (gray rectangles) measured by GSEA for the indicated gene sets. The false discovery rate was obtained by calculating ES for 1000 gene-set permutations.

