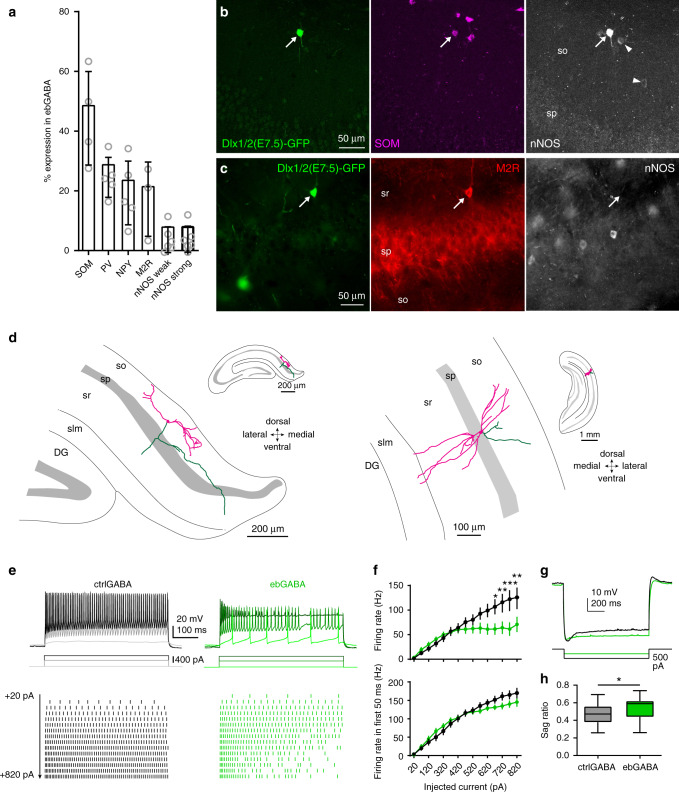
Fig. 3. Adult ebGABAs display distinct anatomical and electrophysiological properties.
a Quantification of the expression of single molecular markers in CA1 ebGABA. SOM: n = 4 mice; PV: n = 5 mice; NPY: n = 5 mice; M2R: n = 3 mice; nNOS weak/strong: n = 5 mice. Bar plots represent means. Error bars represent SDs. b Example ebGABA in stratum oriens expressing SOM and strong levels of nNOS (arrow). Note that neurons expressing weak levels of nNOS (arrowheads) are SOM immunonegative. Experiment repeated independently in four mice with similar results. c EbGABA in stratum radiatum expressing only M2R but not nNOS (arrow). Experiment repeated independently in three mice, obtaining similar results. d Neurolucida reconstructions of representative neurobiotin-filled ebGABA in the adult CA1. Axon is depicted in green. Soma and dendrites are colored in magenta. Inset: zoomed out representation to illustrate the rostro-caudal and dorso-ventral position. e Representative responses to +20, +520, and +820 pA current injections in ctrlGABA and ebGABA. Note the lower firing rate of the ebGABA in response to stronger current injections. f Top, f/I plot showing reduced excitability of ebGABA with strong current injections. Effect of current injection F(14,864) = 31.59, P < 0.0001; effect of birth date F(7,864) = 16.40, P < 0.0001, interaction F(98, 864) = 1.881 P < 0.0001, two-way ANOVA with Bonferroni post hoc test. Bottom, f/I plot limited to the first 50 ms of the current injection. Effect of current injection F(14,461) = 77.8, P < 0.0001; effect of birth date F(1,461) = 3.211, P = 0.0738, interaction F(1,461) = 1.676, P = 0.0573, two-way ANOVA with Bonferroni multiple comparisons test. CtrlGABAs: n = 18; ebGABAs: n = 16. Data are represented as means ± standard errors of the means. g Representative sag response of a ctrlGABA (black trace, −500 pA current injection) and an ebGABA (green trace, −250 pA current injection). Each trace is an average of three sweeps. h EbGABAs (n = 16 cells) display a significantly higher sag ratio (i.e., a lower sag amplitude) than ctrlGABAs (n = 18 cells, P = 0.028, two-sided Mann–Whitney U test). Boxplots represent medians (center), interquartile ranges (bounds), minima and maxima (whiskers). *P < 0.05; **P < 0.01; ***P < 0.001. so stratum oriens, sp stratum pyramidale, sr stratum radiatum, slm stratum lacunosum-moleculare. Source data are provided as a Source Data file.

