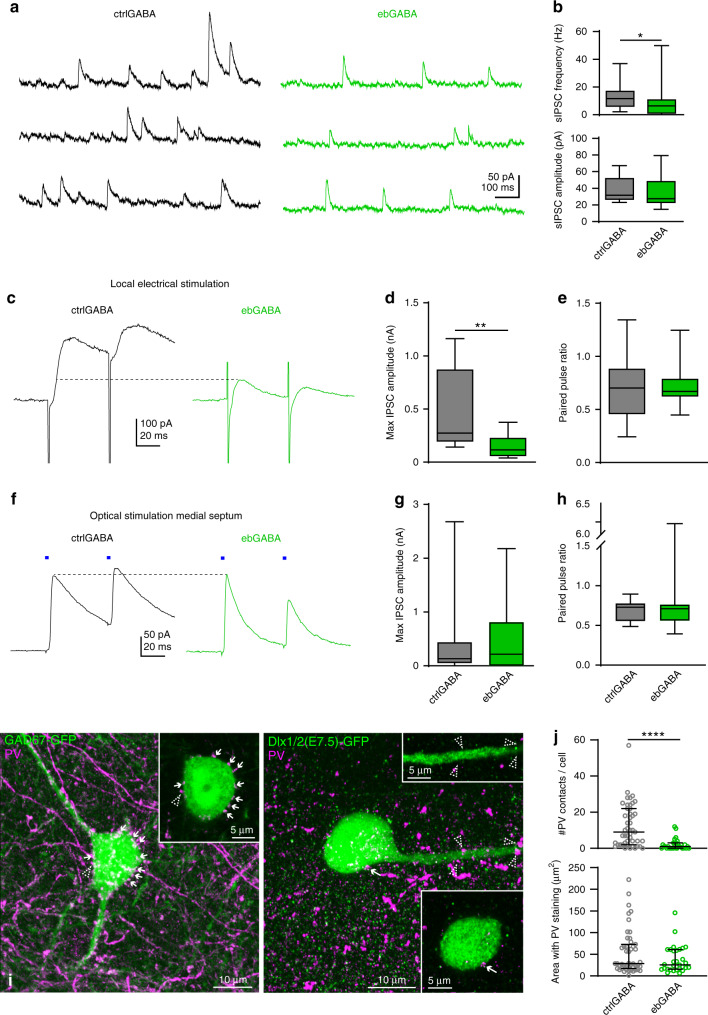
Fig. 5. Sparse local inhibitory inputs onto adult ebGABAs.
a Example voltage clamp traces showing lower sIPSC frequency in a ebGABA cell than in a ctrlGABA cell. b sIPSC frequency but not amplitude is significantly lower in ebGABAs (n = 17 cells) than ctrlGABAs (n = 18 cells; P = 0.043, two-sided Mann–Whitney U test). c Representative IPSCs evoked by local electrical stimulation. IPSCs evoked in the ctrlGABA cell display higher amplitude than the ones evoked in the ebGABA cell. Stimulation artifacts were trimmed for clarity. d The maximum amplitude of the IPSC evoked by local electrical stimulation is significantly lower in ebGABAs than ctrlGABAs (P = 0.0085, Mann–Whitney U test, ctrlGABAs n = 10, ebGABAs n = 8). e IPSC paired pulse ratio is not statistically different between ctrlGABAs and ebGABAs (P = 0.792, two-sided Mann–Whitney U test, ctrlGABA n = 10, ebGABA n = 8). f Representative IPSCs evoked by optical stimulation of medial septal terminals. IPSCs evoked in ctrlGABA and ebGABA cells display similar amplitudes. g, h No significant difference between ebGABAs (n = 12 cells) and ctrlGABAs (n = 13 cells) in maximum amplitude (P = 0.611, two-sided Mann–Whitney U test) and paired pulse ratio (P = 0.796, two-sided Mann–Whitney U test) of the IPSCs evoked by optical stimulation of septal terminals. i Representative maximum intensity projections of confocal z-stacks showing innervation of a ctrlGABA and an ebGABA by PV+ boutons. Appositions between PV+ boutons and GFP+ somata or dendrites are highlighted with arrows; lack of apposition is marked with dashed arrowheads. Insets: single optical sections (thickness 0.41 µm) showing magnifications of the appositions. Left, z-stack depth 20.5 µm. Right, z-stack depth 15.17 µm. Experiment repeated independently for 47 ctrlGABAs and 30 ebGABAs with similar results. j EbGABAs display a significantly lower number of PV+ appositions than ctrlGABAs (top, P < 0.0001, two-sided Mann–Whitney U test, n = 47 ctrlGABAs, n = 30 ebGABAs); area of the PV staining is not significantly different between the two populations of cells (bottom, P = 0.236, two-sided Mann–Whitney U test, n = 47 ctrlGABAs, n = 30 ebGABAs). Boxplots in panels b, d, e, and g, h represent medians (center), interquartile ranges (bounds), minima and maxima (whiskers). In panel j, data are represented as scatter plots with medians and interquartile ranges. *P < 0.05. **P < 0.01. ****P < 0.0001. Source data are provided as a Source Data file.

