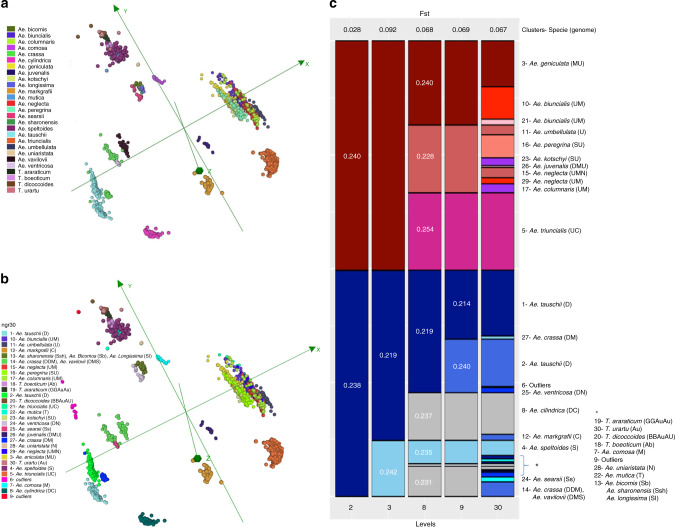
Fig. 3. Diversity analysis of CWR accessions.
a Multidimensional scaling plot visualized in Curlywhirly of 3903 CWR accessions based on Jaccard distance using 61,505 SilicoDArT markers, including the 27 wild relative species; b CWR distributed in 30 clusters; c Representation of the distribution of 30 groups based on cluster analysis. The graph should be interpreted from left to right. The size of the boxes is proportional to the number of accessions. On the right edge are the numbers of the clusters, species name, and the genome constitution (bold) for each species.

