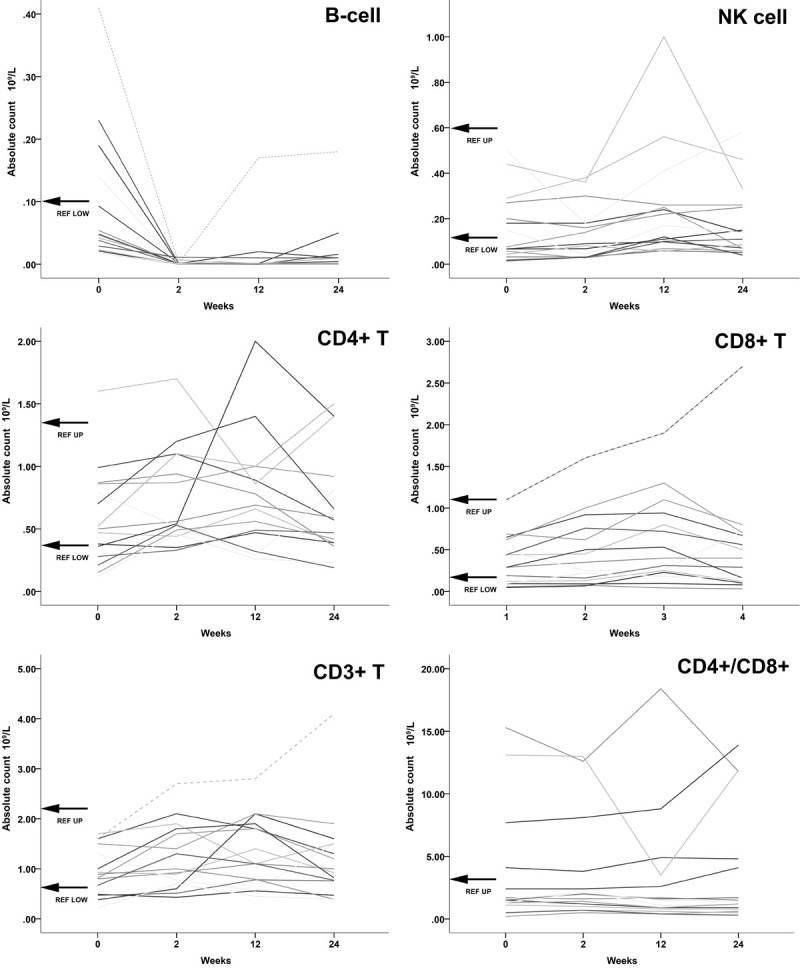
Figure 1.

All absolute values displayed of cell counts in 109/L and weeks after initial RTX therapy at baseline (0 weeks) and second infusion at week 2. Top left: B-cells. Absolute B-cell counts were far below lower normal reference values within 2 weeks, therefore upper limit is not visible in this scale. One patient showed B cell recovery after 3 months to lower range reference values. Top right: NK cells. Most values did not appear to change significantly. Middle left: CD4+ T-cell. Values fluctuated mostly within normal reference values with no clear indication of changes. Middle right: CD8+ T-cell. Values mostly within normal limits with no apparent change after RTX. Bottom left: CD3+ T-cell. No apparent changes after RTX therapy with values well within normal limits. Bottom right: CD4+/CD8+ ratio. Few patients with higher ratios but remained without significant changes after 3-months.
