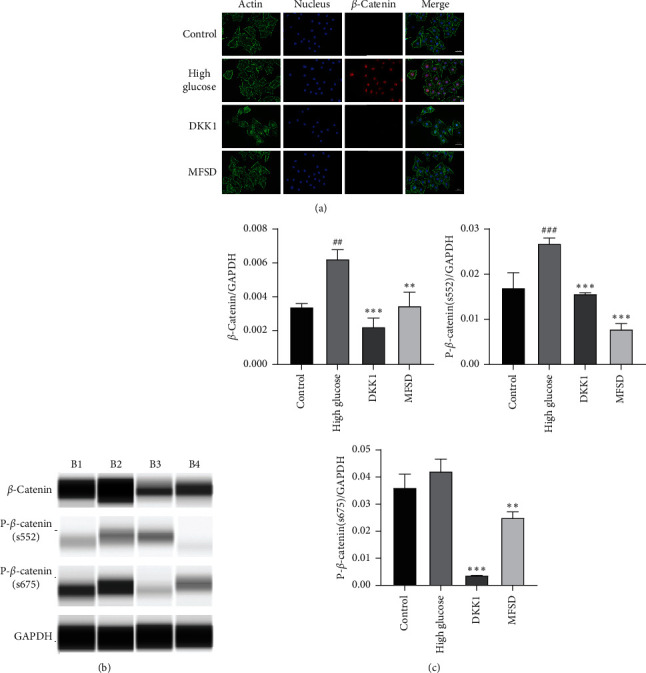
Figure 3.

MFSD inhibits Wnt/β-catenin signaling pathway activation. (a) Immunofluorescence for the expression of β-catenin in the control group, high glucose group, and MFSD group; red represents β-catenin, green represents cytoskeleton, and blue represents nucleus. (b) The protein expressions of β-catenin, p-β-catenin (s552), and p-β-catenin (s675) were analyzed by western blot. B1 represents control group, B2 represents high glucose group, B3 represents DKK1 group, and B4 represents MFSD group. (c) Quantitative statistical analysis of western blot. The obtained values of β-catenin, p-β-catenin (s552), and p-β-catenin (s675) were normalized to the GAPDH.#P < 0.05, ###P < 0.01, and ###P < 0.001 compared with control group; ∗P < 0.05, ∗∗P < 0.01, and ∗∗∗P < 0.001 compared with high glucose group.
