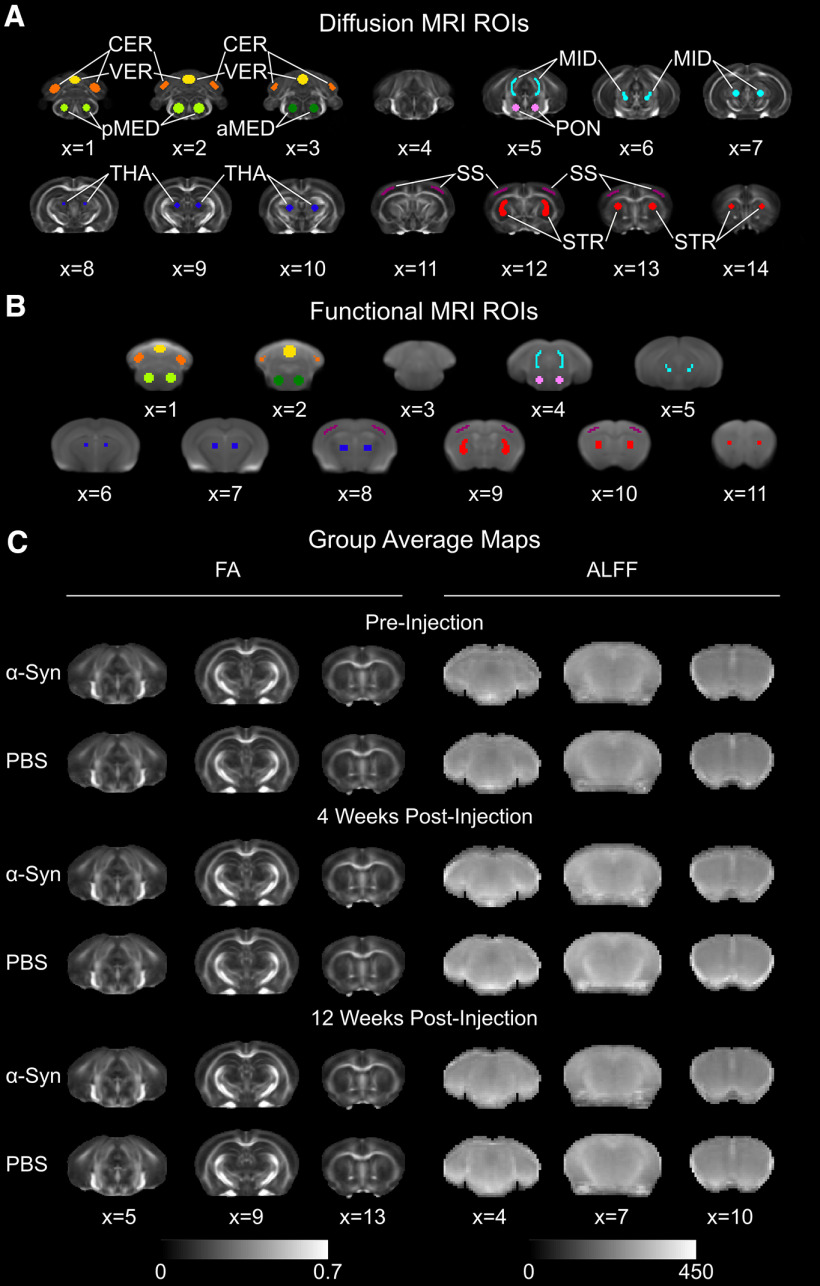
Figure 2.
ROIs and group average maps. A, dMRI ROIs overlaid on top of the fractional anisotropy (FA) template image: cerebellum (orange), vermis (yellow), posterior medulla (light green), anterior medulla (dark green), pons (pink), midbrain (turquoise), thalamus (dark blue), somatosensory cortex (purple), striatum (red). B, fMRI ROIs. The underlay is a representative temporal mean resting-state fMRI image averaged across subjects. The color scheme of the ROIs matches that of A. C, Representative slices from the group average FA and ALFF maps for all three time points.

