Figure 3.

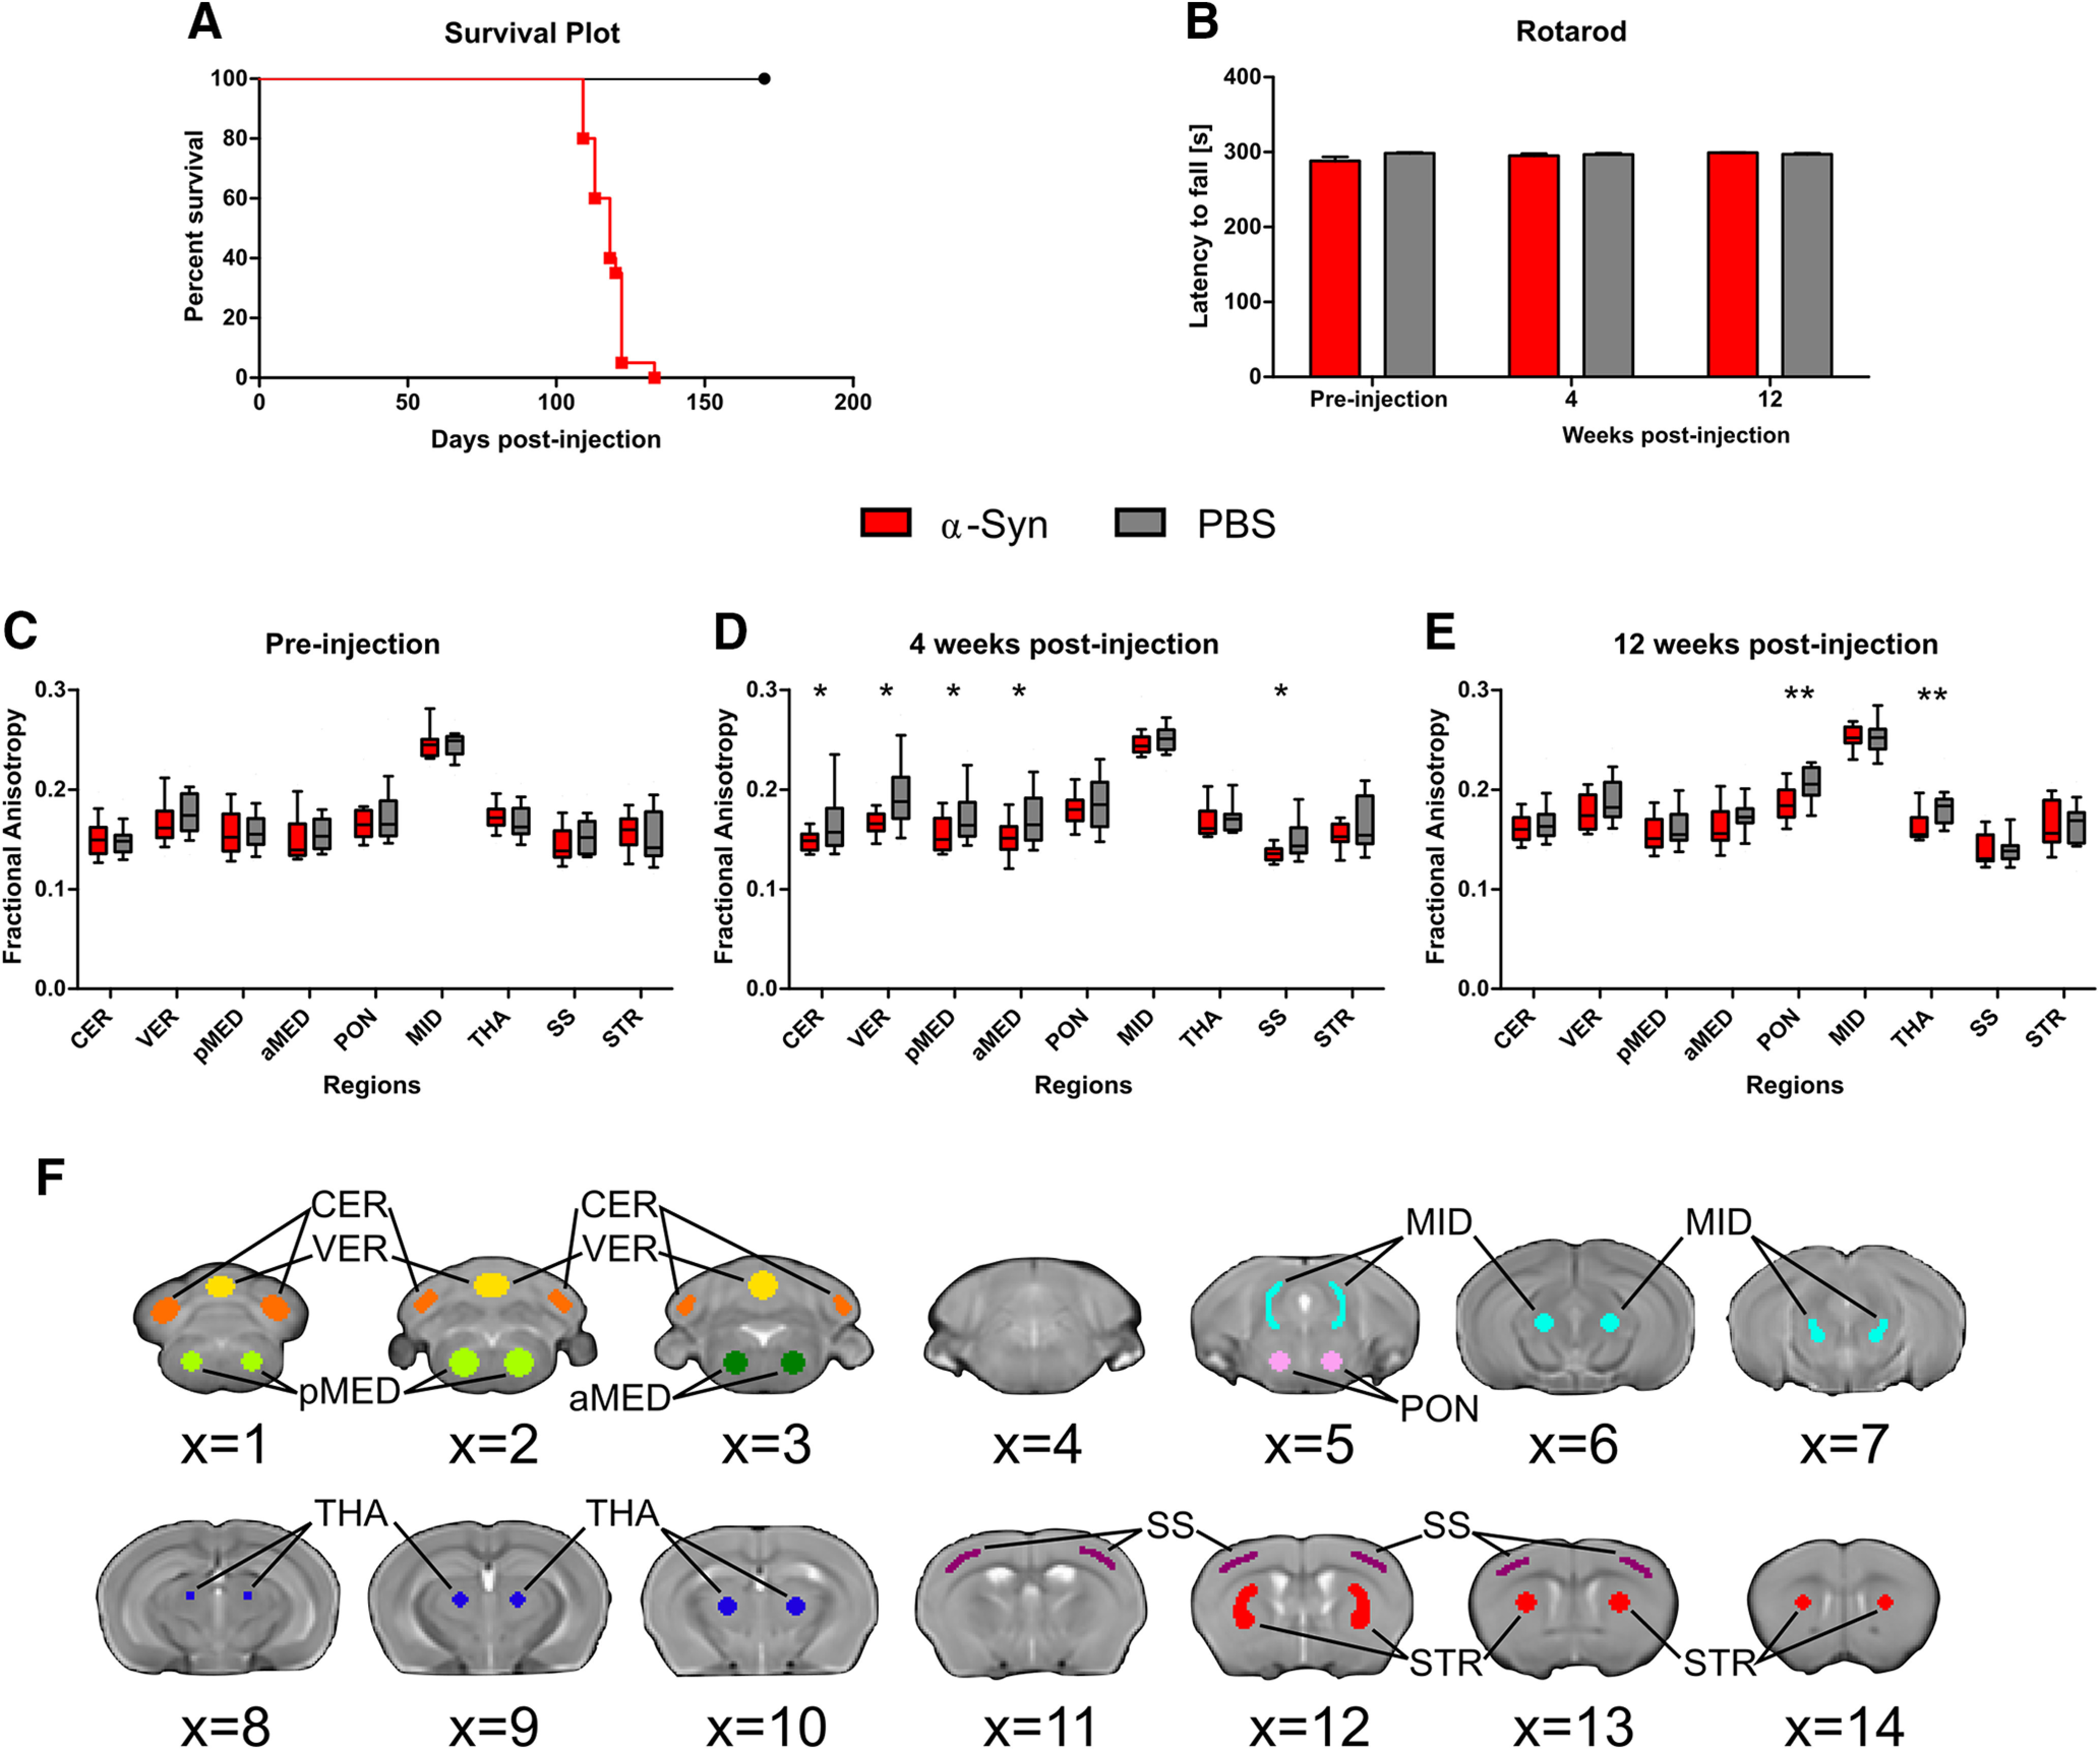
Intramuscular injection of α-syn fibrils induces structural changes in the brain and death. A, Kaplan–Meier survival plot comparing survival times of mice intramuscularly injected with α-syn to PBS-injected control mice. B, Bar plot shows mean latency to fall of the six rotarod test trials at each of the three examined timepoints. Between-group differences in latency to fall were not statistically significant. Error bars designate SEM. C–E, Box plots show the interquartile range for fractional anisotropy measured using diffusion-weighted MRI pre-injection (C), four weeks post-injection (D), and 12 weeks post-injection (E). Fractional anisotropy was calculated in α-syn and PBS control mice in ROIs: cerebellum (CER), vermis (VER), posterior medulla (pMED), anterior medulla (aMED), pons (PON), midbrain (MID), thalamus (THA), somatosensory cortex (SS), striatum (STR). Regions with significant differences between groups after FDR correction are designated with asterisk(s) (*pfdr < 0.05; **pfdr < 0.01). F, Hand-drawn ROIs used in dMRI analyses. Voxels in the center of each region were chosen to make results robust to minor registration errors, common to scans with severely anisotropic voxel sizes. Regions were drawn on and are displayed overlaid over the B0 template: cerebellum (orange), vermis (yellow), posterior medulla (light green), anterior medulla (dark green), pons (pink), midbrain (turquoise), thalamus (dark blue), somatosensory cortex (purple), striatum (red).
