
Figure 4.
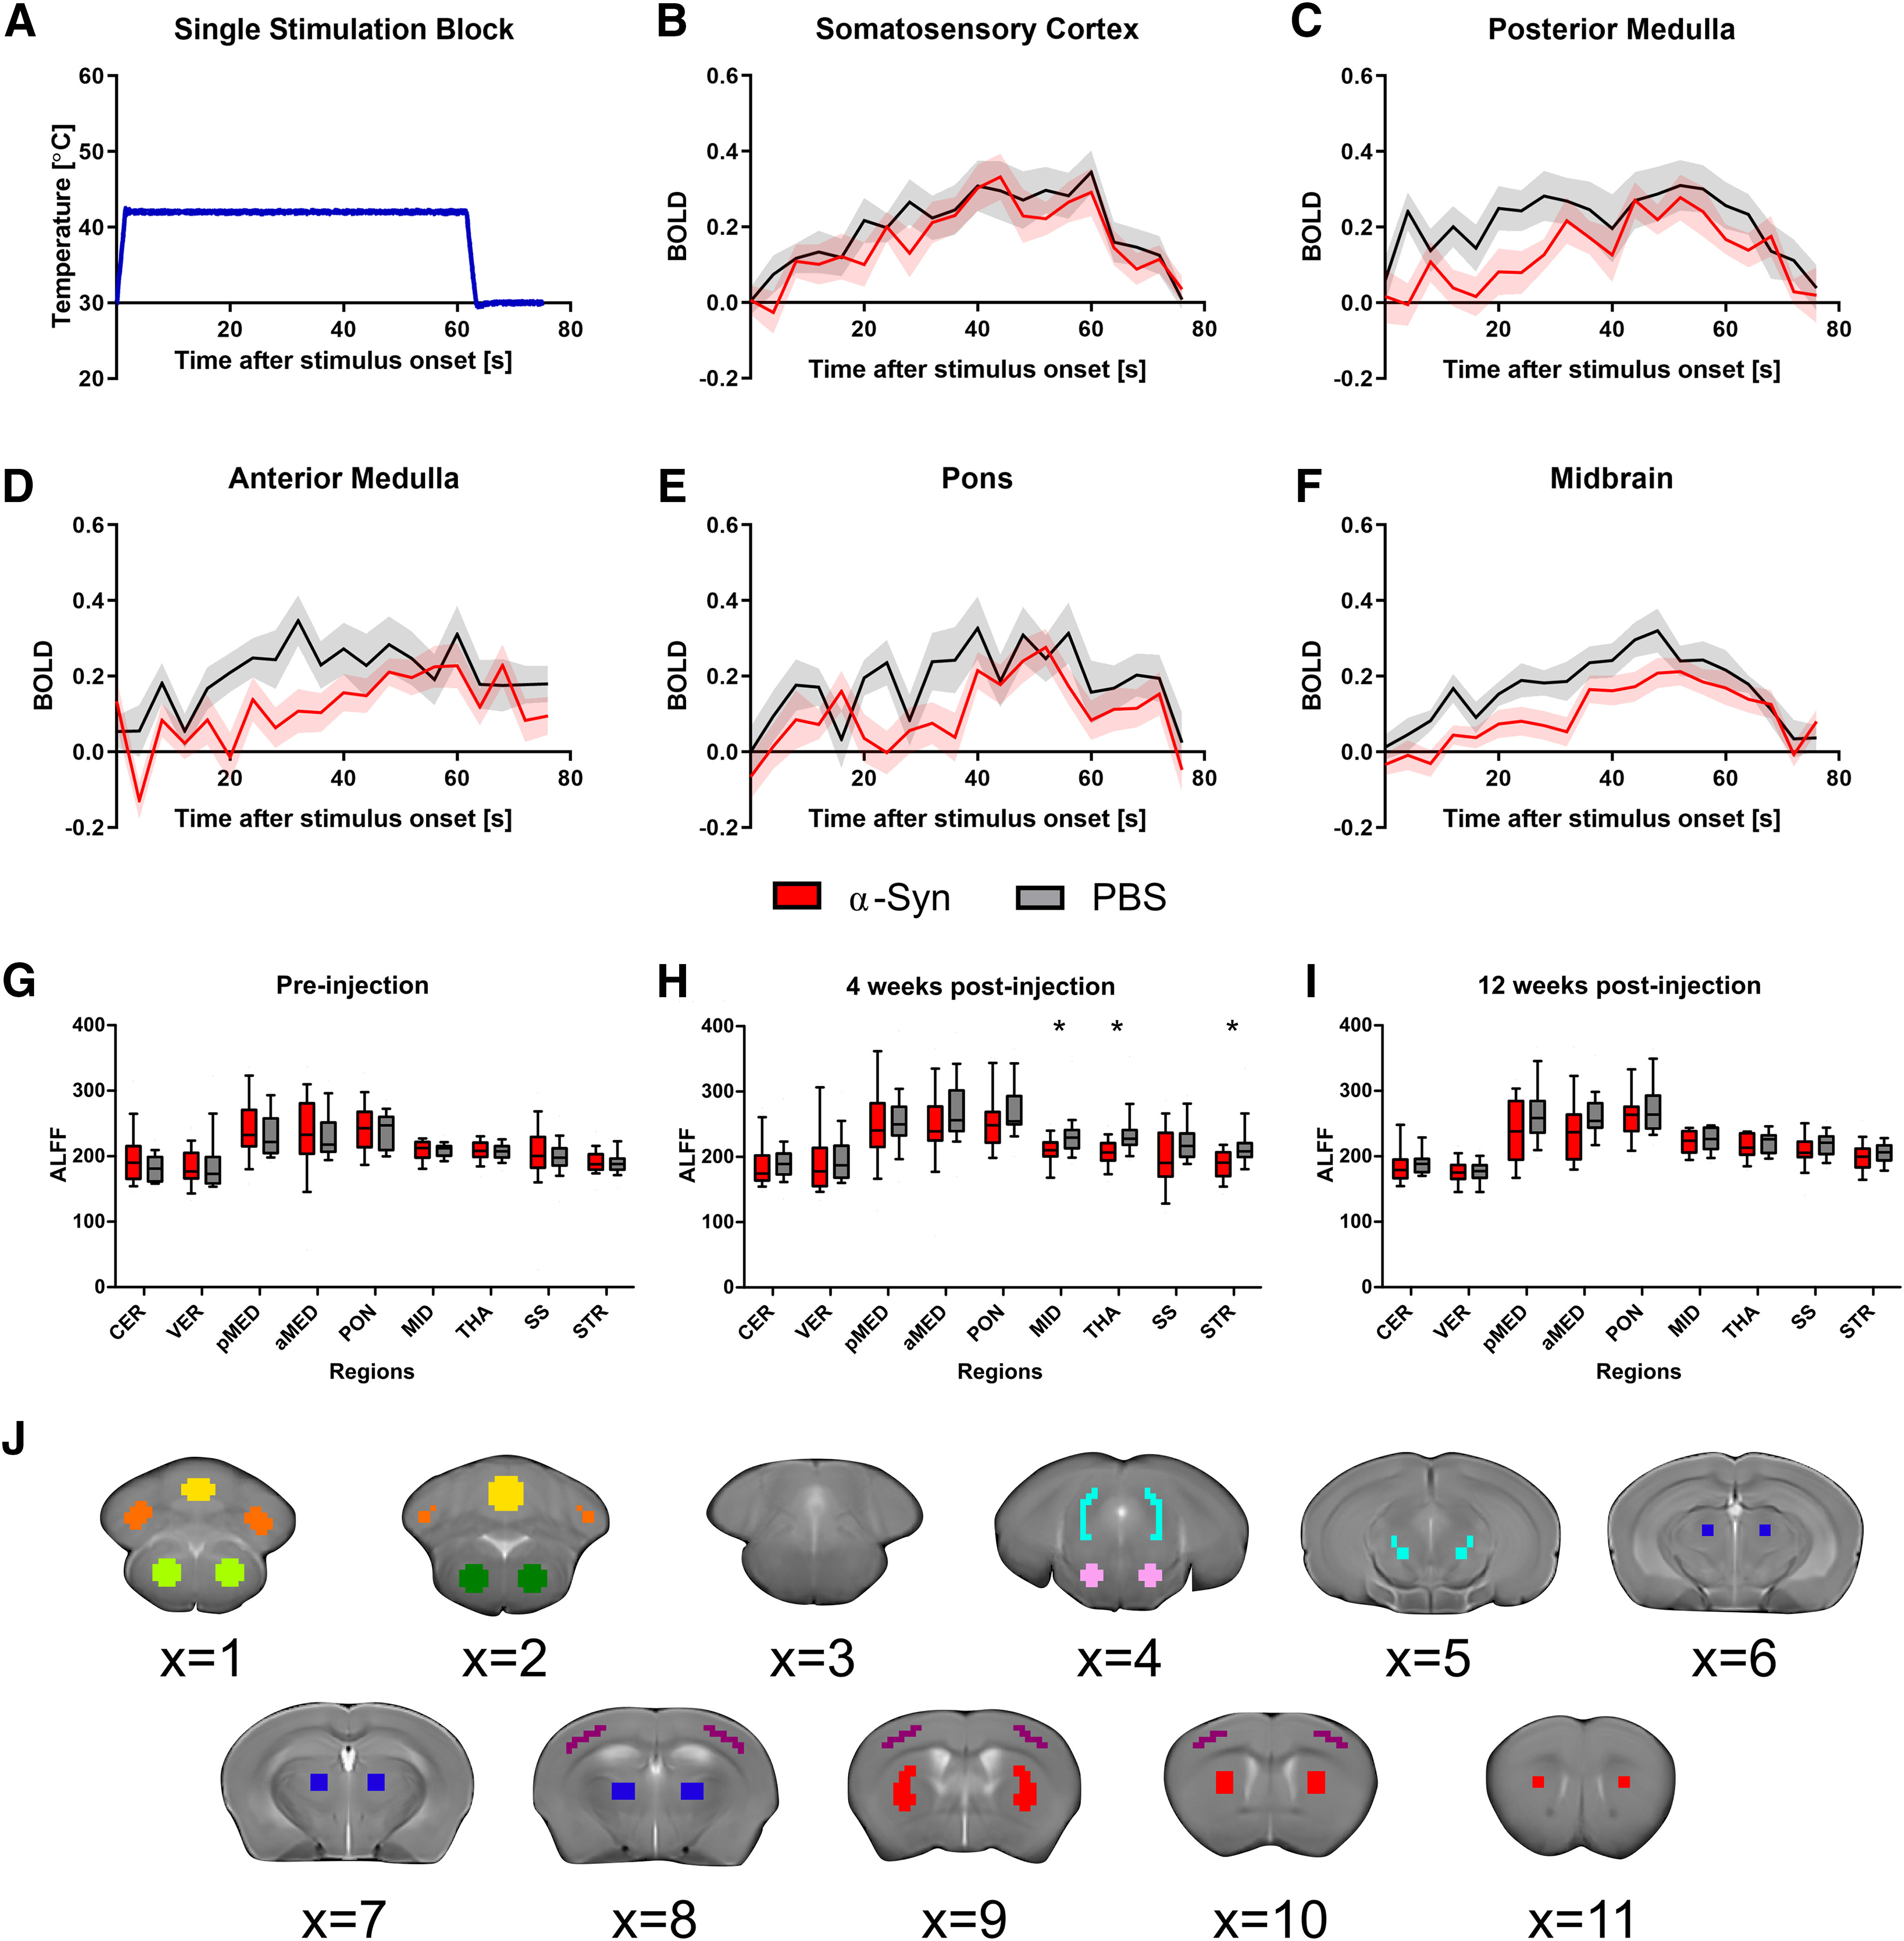
Intramuscular injection of α-syn fibrils induces reduced functional activity compared with PBS controls. A, The temperature profile of one 60-s stimulation block applied to the plantar hind paw during the sensory-evoked fMRI scans. B, BOLD signal in the somatosensory cortex as a result of the thermal stimulation profile given in A. Signal was calculated at 4-s intervals from stimulation onset until 16 s after simulation termination. The somatosensory cortex confirms a robust increase in the BOLD signal followed by a decrease in the BOLD signal at stimulation termination. Semi-transparent region designates SEM. C–F, At 12 weeks post-injection, mice that were inoculated with α-syn fibrils had significantly reduced BOLD signal in the (C) posterior medulla, (D) anterior medulla, (E) pons, and (F) midbrain compared with PBS controls. Semi-transparent region designates SEM. G–I, Box plots show the interquartile range for the ALFF measured using resting-state fMRI (G) pre-injection, (H) four weeks post-injection, and (I) 12 weeks post-injection. ALFF was calculated in α-syn and PBS control mice in ROIs: cerebellum (CER), vermis (VER), posterior medulla (pMED), anterior medulla (aMED), pons (PON), midbrain (MID), thalamus (THA), somatosensory cortex (SS), striatum (STR). Regions with significant differences between groups after FDR correction are designated with asterisk(s) (*pfdr < 0.05; **pfdr < 0.01). J, ROIs used in fMRI analyses were derived from the dMRI ROIs by linear registration of the B0 template to the T2 anatomic template. Regions were drawn on and are displayed overlaid over the T2 anatomic template: cerebellum (orange), vermis (yellow), posterior medulla (light green), anterior medulla (dark green), pons (pink), midbrain (turquoise), thalamus (dark blue), somatosensory cortex (purple), striatum (red).