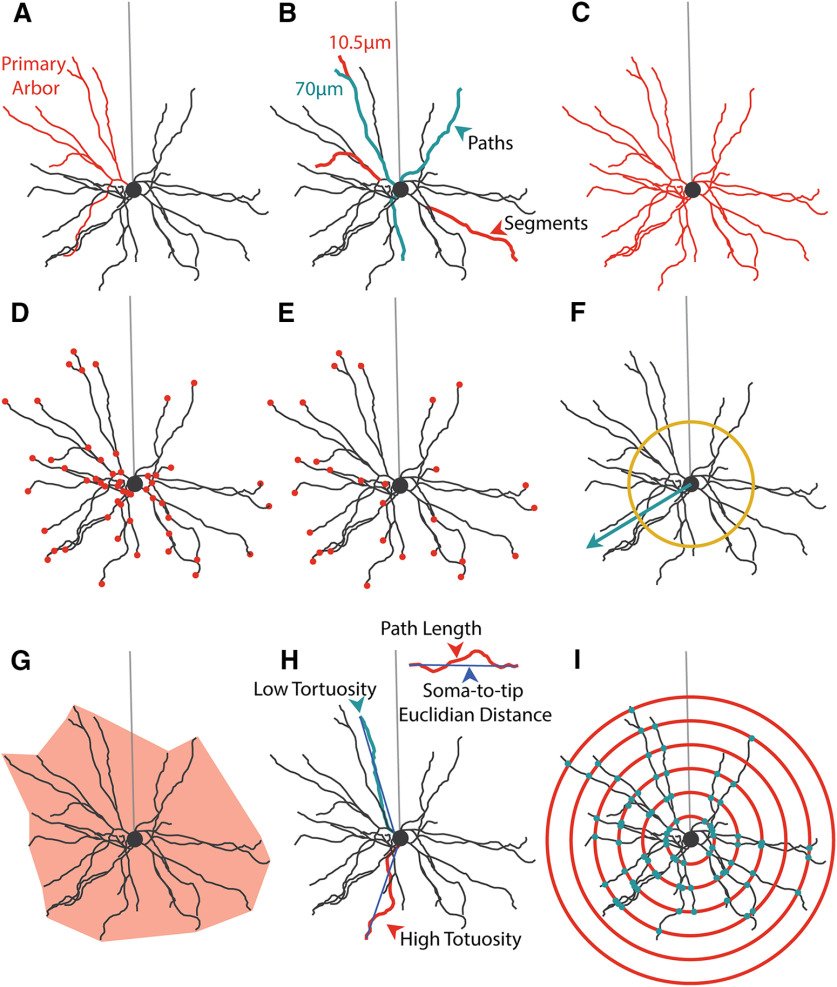
Figure 1.
Analysis of basal dendrite morphology. A, Example hand-reconstructed L2/3 WT pyramidal neuron sampled from mouse primary visual cortex. Coral represents one primary arbor. Light gray represents position of unreconstructed apical dendrite. Soma is diagrammed as a circle. B, Segment (coral) and path (teal) diagram. Segments are the smallest span of dendrite between two branch points. Paths are the length of dendrite that connects branch tips to somas. Paths are composed of one or more segments. C, Total arbor length diagram. Total arbor length is the summed length of all segments, measuring the total length of the arbor in microns. D, Segment number diagram. Each dot (coral) indicates one branch point in the arbor. E, Tip number diagram. Each dot (coral) indicates the terminal tip of a path. This is equivalent to the number of paths. F, Arbor polarity diagram. Arbor polarity is calculated in several ways, including analysis of dendritic material (number and length of segments and paths) on each side of the soma and in terms of absolute arbor directionality calculated as mean vector length (teal arrow) and tested using the Raleigh test. Mean vectors with length greater than yellow ring indicate significant directionality of the arbor. G, Arbor volume diagram. Arbor volume is the 3D volume of a least-size polygon fitted to all points in the basal arbor (light coral). Arbor density is the total arbor length divided by the arbor volume. H, Tortuosity diagram. Tortuosity is the path length for an individual path divided by the soma-to-tip Euclidian distance. I, Sholl analysis diagram. Sholl analysis counts the number of segments (teal dots) at several evenly spaced distances from the soma (coral circles) to measure the relationship between distance from the soma and arbor complexity.

