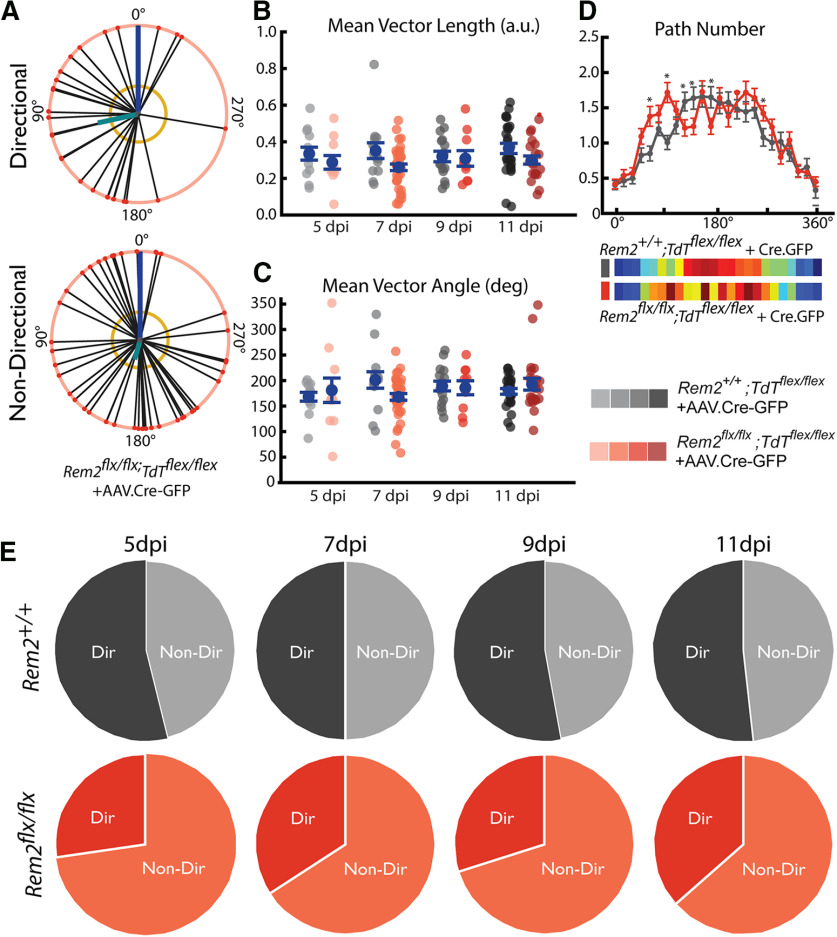
Figure 11.
Rem2 promotes basal dendrite coronal polarity. A, Example directional (top) and nondirectional (bottom) basal arbors sampled from Rem2flx/flx;Tdtflex/flex + AAV.Cre-GFP mice in the coronal viewpoint. Each arbor is schematized as soma (middle dot) and soma-to-tip vectors (lines with dots at tip) arranged on a unit circle with apical dendrite diagrammed as blue line. Thick teal line indicates the mean directional vector. Yellow circle represents length of mean directional vector required to declare the arbor directional by the Raleigh test. B, Length of the mean vector computed for Rem2+/+;Tdtflex/flex + AAV.Cre-GFP and Rem2flx/flx;Tdtflex/flex + AAV.Cre-GFP neurons sampled at 5, 7, 9, and 11 dpi. C, Angle of the mean vector computed for Rem2+/+;Tdtflex/flex + AAV.Cre-GFP and Rem2flx/flx;Tdtflex/flex + AAV.Cre-GFP neurons sampled at 5, 7, 9, and 11 dpi. D, Number of paths per radial bin (radial Sholl) for Rem2+/+;Tdtflex/flex + AAV.Cre-GFP and Rem2flx/flx;Tdtflex/flex + AAV.Cre-GFP neurons pooled across all ages (top) and heat map of the same data (bottom). *p < 0.05 (one-way ANOVA followed by Scheffé test). E, Fraction of neurons meeting the Raleigh test criterion for significant directionality of the basal arbor is noticeably decreased (∼20% decrease) in Rem2flx/flx;Tdtflex/flex + AAV.Cre-GFP neurons at all sampled ages. Error bars indicate mean ± SEM. Blue dots indicate means. Gray/coral dots indicate single neurons. For all Rem2flx/flx;Tdtflex/flex + AAV.Cre-GFP measurements: 5 dpi: N = 11 cells, 4 mice; 7 dpi: N = 38 cells, 7 mice; 9 dpi: N = 10 cells, 4 mice; 11 dpi: N = 22 cells, 4 mice. For all Rem2+/+;Tdtflex/flex + AAV.Cre-GFP measurements: 5 dpi: N = 13 cells, 5 mice; 7 dpi: N = 14 cells, 5 mice; 9 dpi: N = 17 cells, 4 mice; 11 dpi: N = 27 cells, 6 mice. *p < 0.0125 (Wilcoxon rank-sum test, Bonferroni-corrected α = 0.0125).

