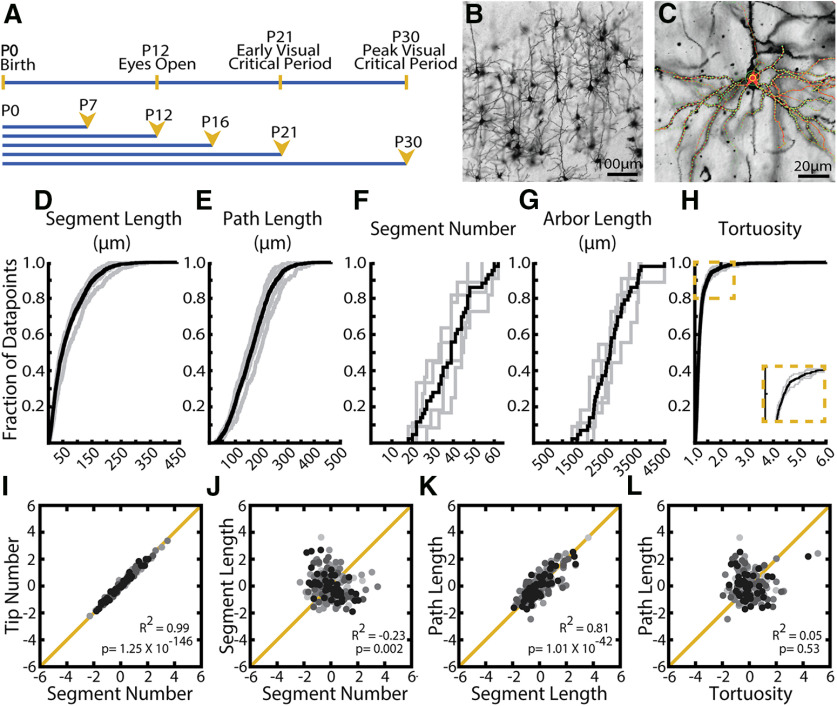
Figure 3.
Distributions of observed values for arbor parameters suggest distinct regulatory mechanisms. A, Timelines of visual development in the mouse (top) and morphologic sampling across development (bottom). Ages sampled indicated by postnatal day (P#) and yellow arrowheads. B, Example field of Golgi-stained cortical pyramidal neurons demonstrating dark fill of neurites and ability to differentiate cell types. C, Example 3D tracing of basal dendrites of L2/3 pyramidal neuron in visual cortex. Green circles represent experimenter-placed nodes. Red lines indicate edges connecting nodes. Some traced branches are not in-plane. D–H, Cumulative distributions of (D) segment length, (E) path length (F), segment number (G), arbor length, and (H) tortuosity. Gray lines indicate all observations from individual WT mice at age P30. Black lines indicate the complete population of all observations across animals at P30. I-L, Correlations between listed parameters for entire population of all neurons across all ages. R2 values and p values are listed for each comparison. Neurons sampled at different ages are indicated by different colors, with light grays representing young animals and black representing older animals. No noticeable clustering by age was observed.

