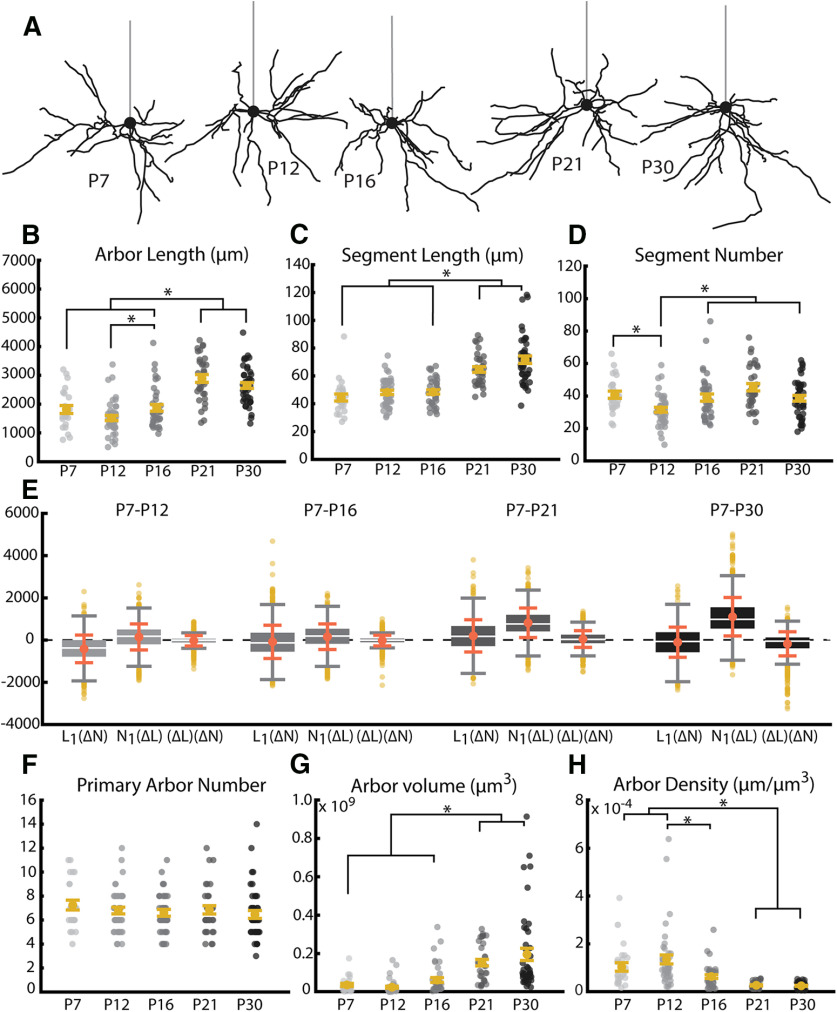
Figure 4.
Length and volume of WT arbors undergo significant growth near the opening of the visual critical period coincident with an increase in the length of dendritic branches. A, Example reconstructions of basal arbors from L2/3 WT visual cortex neurons at the five ages sampled. Straight gray lines diagram the unreconstructed apical dendrite to indicate the orientation of cells. B, Total arbor length of the basal arbor across development. Light to dark gray dots indicate individual neurons. C, Segment length of basal dendrites across development. Segment length for each neuron is an average of all path lengths sampled from that cell. Light to dark gray dots indicate individual neurons. D, Segment number of basal dendrites across development. Light to dark gray dots indicate individual neurons. E, Analysis of relative contribution of changes in segment number (L1(ΔN)), segment length (N1(ΔL)), or the combination of these factors ((ΔL)(ΔN)). Boxes represent 25th-75th percentile of the data. White line indicates median. Coral dot and error bars indicate mean ± SE. F, Number of dendritic trees (number of primary neurites) of basal dendrites across development. Yellow dots indicate flyers. G, Three-dimensional volume of convex hull fit to nodes composing basal arbor across development. H, Density of the basal arbor across development. Calculated as microns of dendritic material per cubic micron of arbor volume. Error bars indicate mean ± SEM. Yellow dots indicate the mean. Gray dots indicate single neurons. For all measurements: P7: N = 24 cells, 2 mice; P12: N = 43 cells, 4 mice; P16: N = 38 cells, 4 mice; P21: N = 33 cells, 3 mice; P30: N = 43 cells, 4 mice. *p < 0.05 (one-way ANOVA with post hoc Tukey test).

