Figure 5.
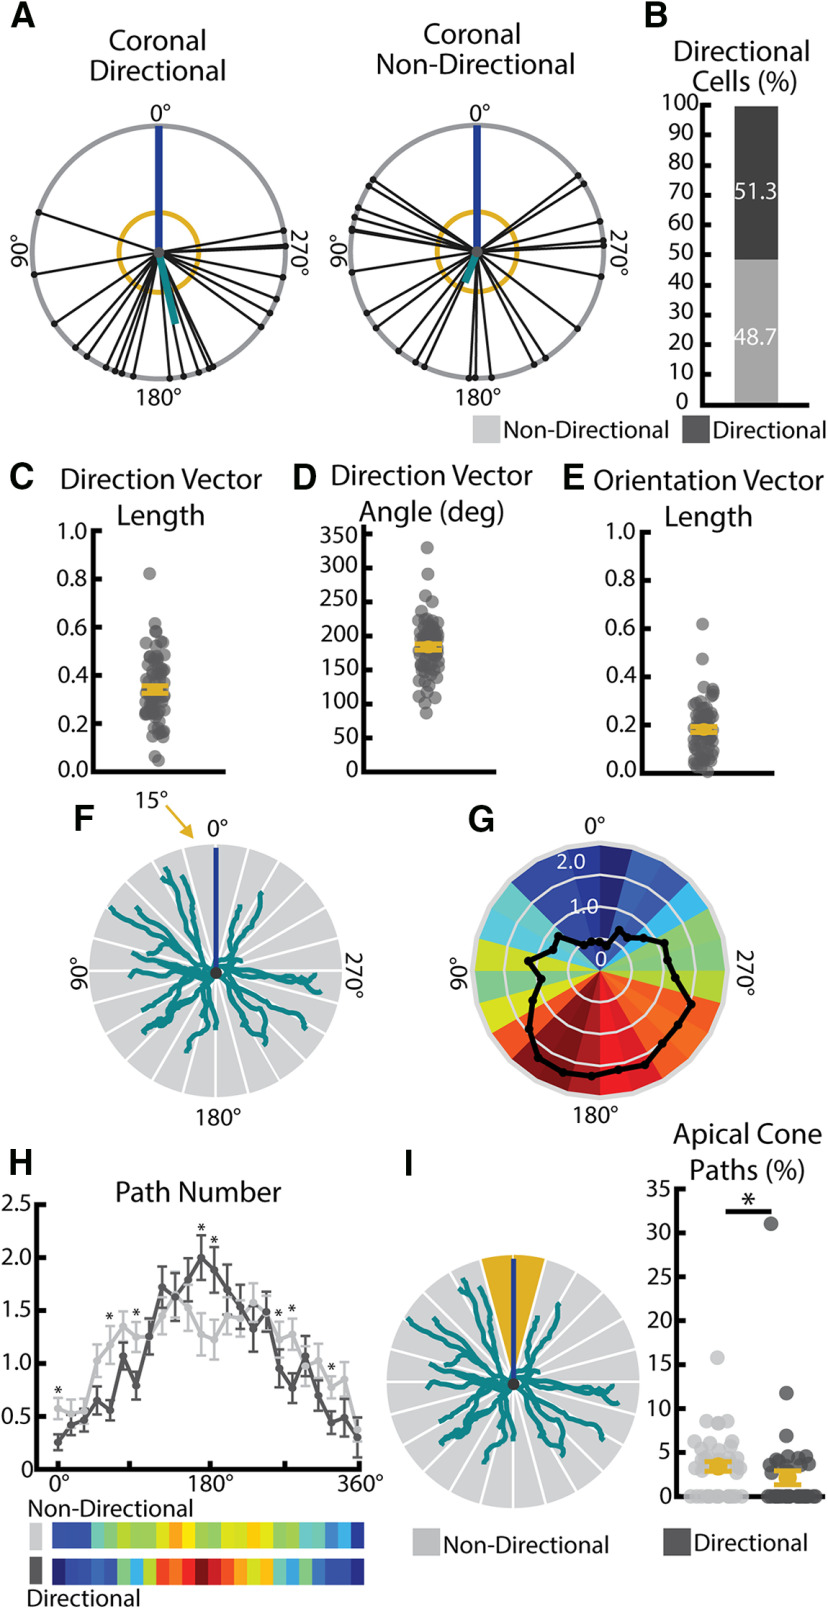
Basal arbors show significant directionality in path location. A, Example directional (left) and nondirectional (right) basal arbors sampled from WT mice in the coronal viewpoint. Each arbor is schematized as soma (center dot) and soma-to-tip vectors (lines with dots at tip) arranged on a unit circle with apical dendrite diagrammed as a blue line. Thick teal line indicates the mean directional vector. Yellow circle represents length of mean directional vector required to declare the arbor directional by the Raleigh test. B, Pie chart showing portion of total WT population that are categorized as direction and nondirectional using the Raleigh test. C, Length of the coronal normalized directional vector calculated from all basal paths. Larger values indicate greater directionality. D, Angle of coronal directional vector calculated from all basal paths. E, Length of the coronal normalized orientation vector calculated from all basal paths. Larger values indicated greater orientation. F, Diagram of radial Sholl measure. Number of paths falling into each 15° increment (gray wedges) is calculated for each cell. Teal represents basal arbor. Blue represents apical dendrite position. G, Heat map indicating number of paths in each 15° bin for each cell (colorful wedges) from many (warm colors) to few (cool colors) and the mean (black line). H, Radial Sholl quantification in 15° bins (top) and represented as heat maps of mean bin values (bottom) for significantly directional (dark gray) and nondirectional (light gray) WT arbors. *p < 0.05 (Scheffé test). Error bars indicate mean ± SEM. I, Diagram of apical cone measurement (left). The number of paths falling in the 30° span around the apical dendrite (“apical cone,” yellow wedges) is calculated for each cell. Number of paths in the apical cone (right) in significantly directional (dark gray) and nondirectional (light gray) arbors. *p < 0.05 (Wilcoxon rank sum test). Error bars indicate mean ± SEM. Yellow dots indicate the mean.

