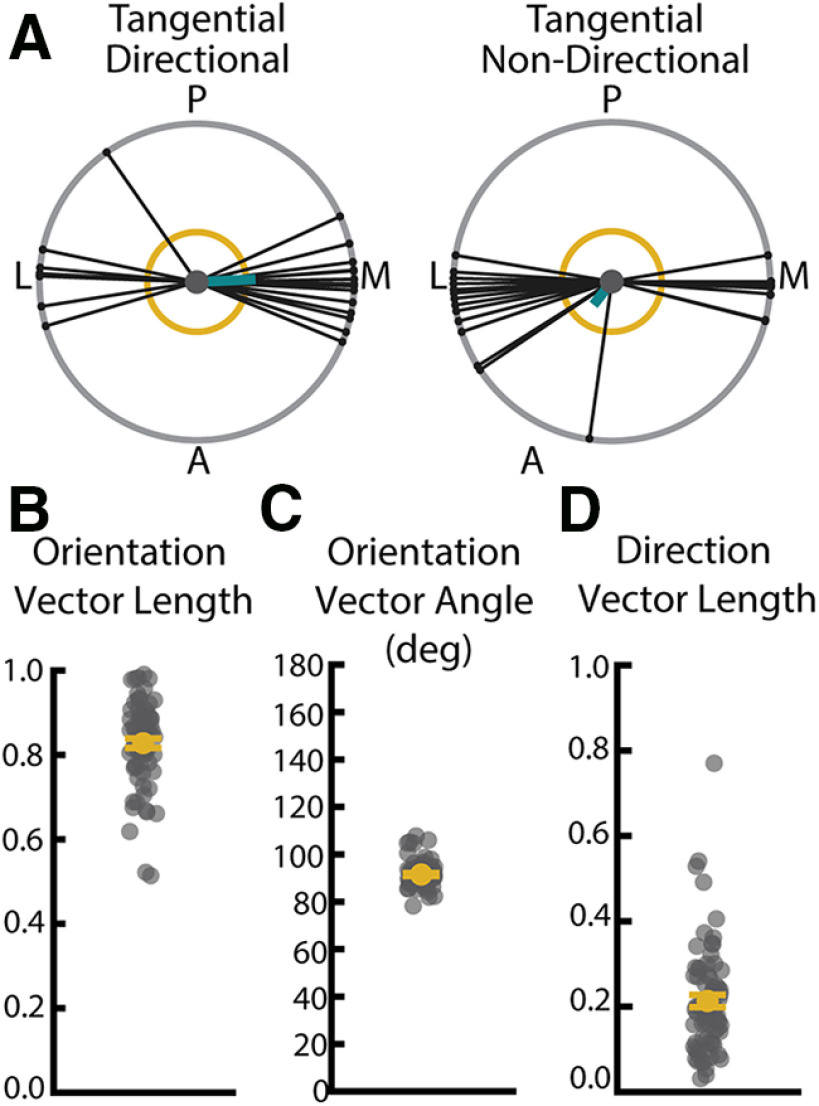
Figure 6.
WT neurons have oriented arbors in the tangential plane. A, Example directional (left) and nondirectional (right) basal arbors sampled from WT mice in the tangential viewpoint. Each arbor is schematized as soma (center dot) and soma-to-tip vectors (lines with dots at tip) arranged on a unit circle. Thick teal line indicates the mean direction vector. Yellow circle represents length of mean direction vector required to declare the arbor directional by the Raleigh test. Posterior (P), anterior (A), medial (M), and lateral (L) are indicated around the diagrams. B, Length of the tangential normalized orientation vector calculated from all basal paths. Larger values indicate greater degree of orientation. C, Angle of tangential orientation vector calculated from all basal paths. D, Length of the tangential normalized direction vector calculated from all basal paths. Larger values indicated greater directionality. Error bars are mean ± SEM. Yellow dots indicate the mean and gray dots indicate single neurons.

