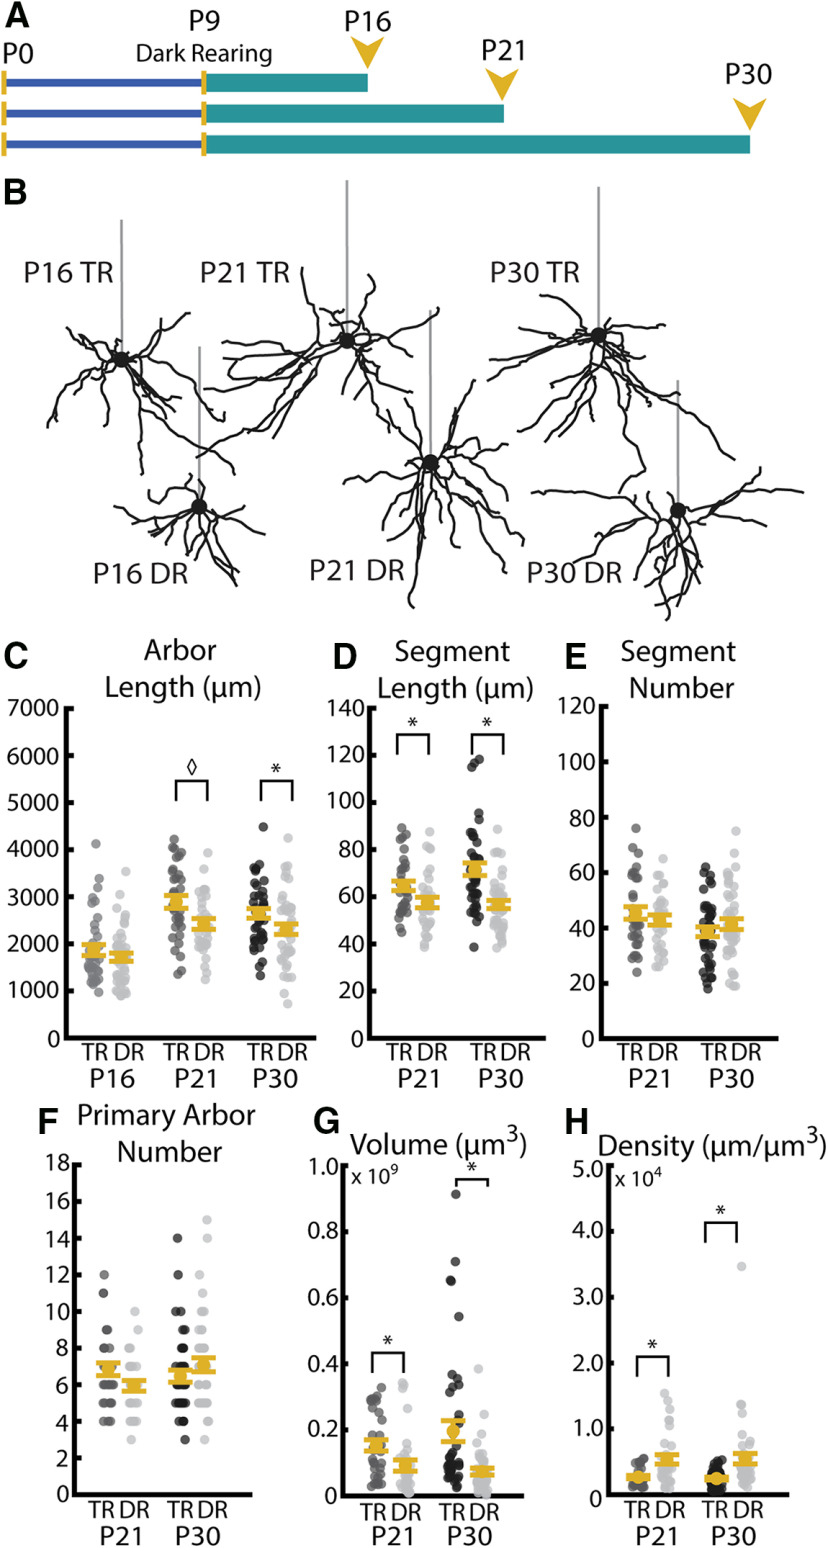
Figure 7.
Visual experience during the critical period promotes increases in segment length leading to typical arbor development. A, Timeline of DR experiments. All mice were DR starting at P9 and DR (indicated by teal bar) continued until death at P16, P21, or P30. B, Example reconstructions of TR (12 h light/12 h dark) and DR (24 h dark) neurons at P16, P21, and P30. Straight gray lines diagram the unreconstructed apical dendrite to indicate the orientation of cells. C, Total arbor length with (TR) and without (DR) visual experience at P16, P21, and P30. D, Segment length at P21 in neurons sampled from mice with and without visual experience at ages P21 and P30. E, Segment number at P21 and P30 in neurons sampled from mice with and without visual experience. F, Primary arbor number sampled at P21 and P30 with and without visual experience. G, Arbor volume sampled at P21 and P30 with and without visual experience. H, Arbor density sampled at P21 and P30 with and without visual experience. Error bars indicate mean ± SEM. Yellow dots indicate means. Gray dots indicate single neurons. For all measurements: P16 TR: N = 38 cells, 4 mice; P16 DR: N = 46 cells, 4 mice; P21 TR: N = 33 cells, 3 mice; P21 DR: N = 32 cells, 4 mice; P30 TR: N = 43 cells, 4 mice; P30 DR: N = 45 cells, 4 mice *p < 0.016; ◊p = 0.017; Welch's t test, Bonferroni-corrected α = 0.016.

