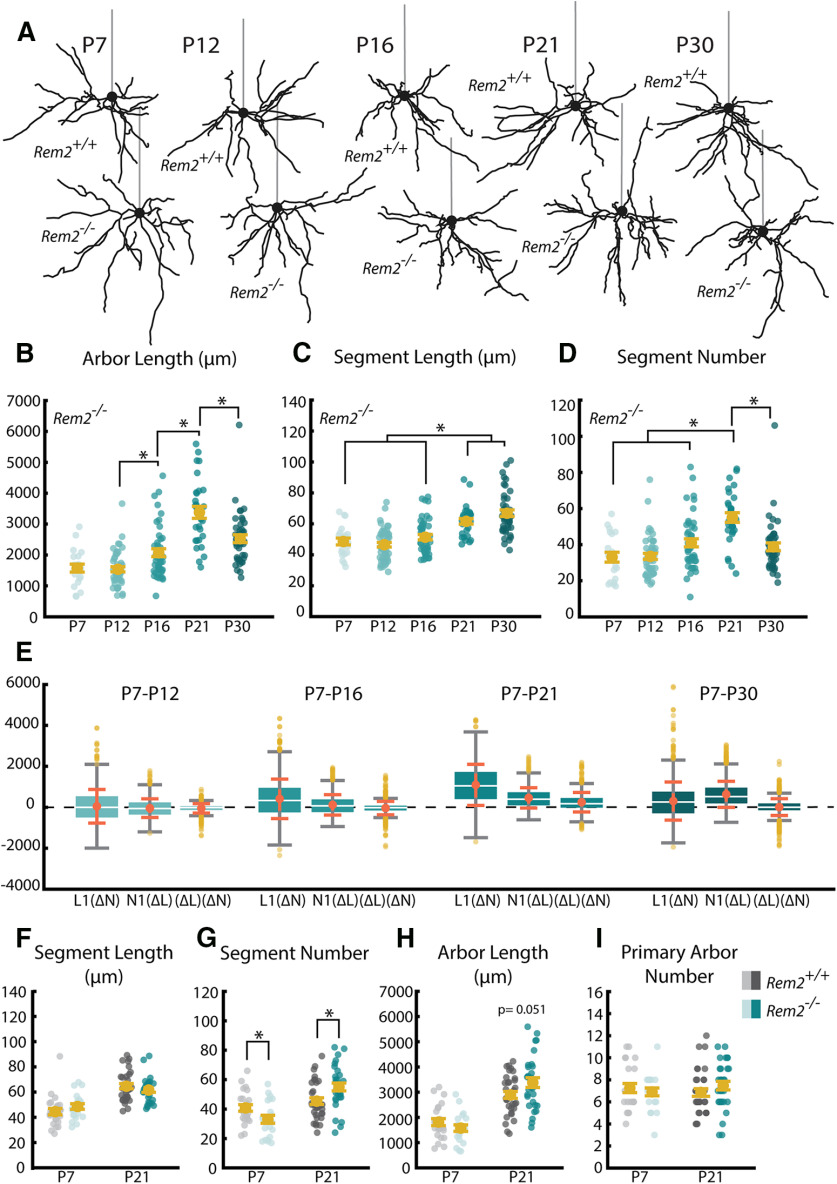
Figure 8.
Rem2 regulates the development of basal dendritic arbors. A, Example reconstructions of TR (12 h light/12 h dark) WT (Rem2+/+) and Rem2 KO (Rem2−/−) neurons at ages P7, P12, P16, P21, and P30. Straight gray lines diagram the unreconstructed apical dendrite to indicate the orientation of cells. B, Total arbor length of the basal arbor in Rem2−/− neurons at P7, P12, P16, P21, and P30. C, Average length of dendritic segments of Rem2−/− neurons sampled at P7, P12, P16, P21, and P30. D, Segment number of Rem2−/− neurons sampled at P7, P12, P16, P21, and P30. E, Number of dendritic primary arbors of basal dendrites across development. Yellow dots indicate flyers. F, Average segment length at ages P7 and P21 sampled from Rem2+/+ and Rem2−/− neurons. G, Segment number at ages P7 and P21 sampled from Rem2+/+ and Rem2−/− neurons. H, Total arbor length at ages P7 and P21 from Rem2+/+ and Rem2−/− neurons. I, Primary arbor number at ages P7 and P21 from Rem2+/+ and Rem2−/− neurons. Error bars indicate mean ± SEM. Yellow dots indicate mean. Teal dots (Rem2−/−) and gray dots (Rem2+/+) indicate single neurons. For all Rem2−/− measurements: P7 TR: N = 21 cells, 2 mice; P12 TR: N = 47 cells, 4 mice; P16 TR: N = 44 cells, 4 mice; P21 TR: N = 30 cells, 3 mice; P30 TR: N = 43 cells, 4 mice. For all Rem2+/+ measurements: P7 TR: N = 24 cells, 2 mice; P21 TR: N = 33 cells, 3 mice. B–D, *p < 0.05 (one-way ANOVA with post hoc Tukey test). F–I, *p < 0.025 (Welch's t test, Bonferroni-corrected α = 0.025).

