Figure 9.
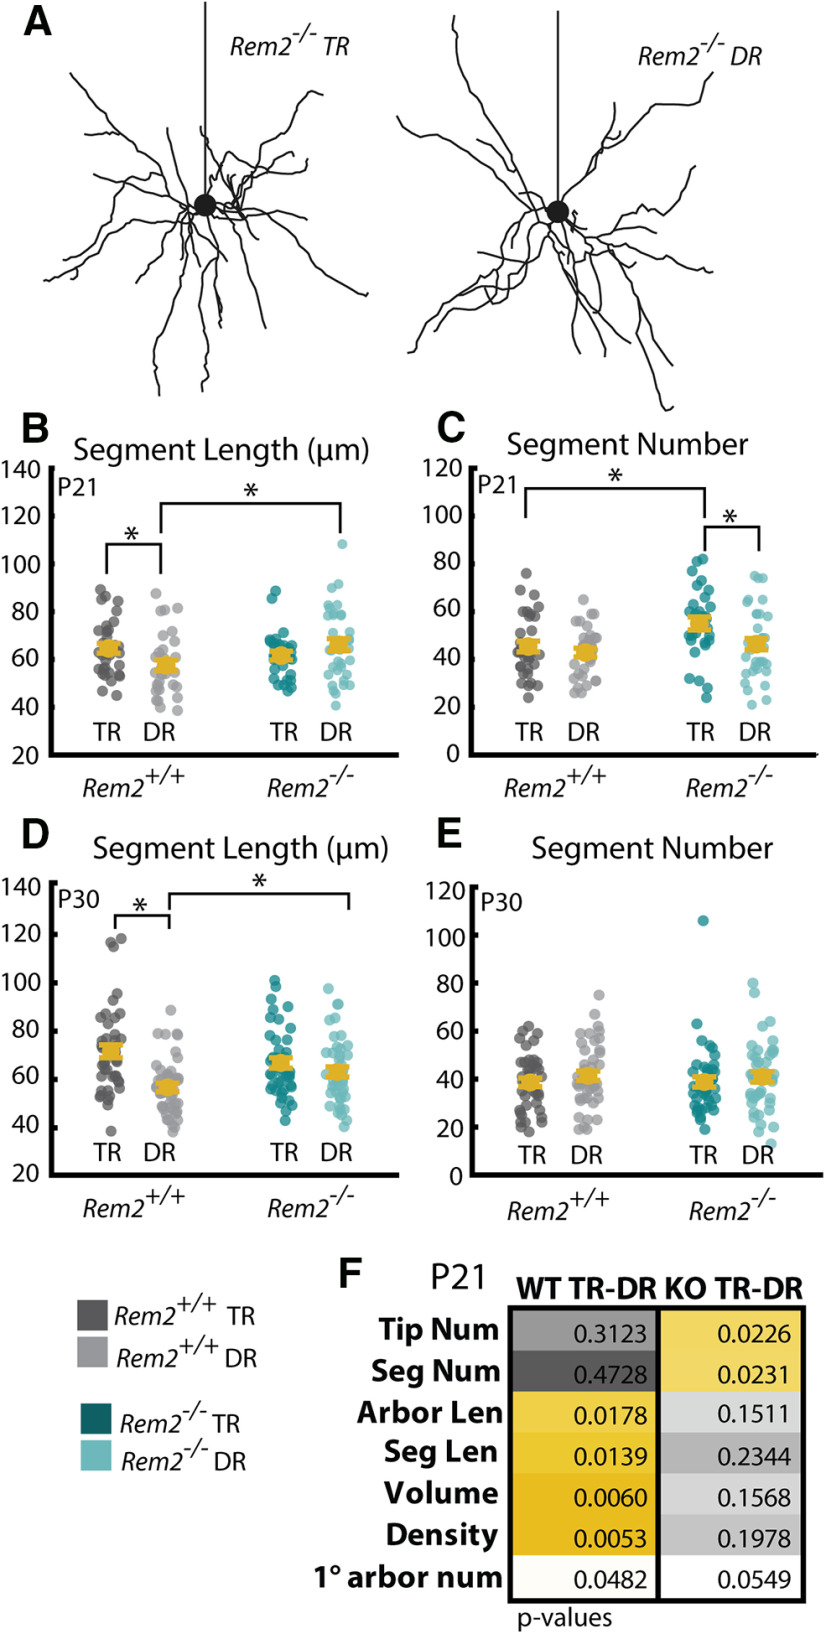
Rem2 regulates segment number in an experience-dependent manner. A, Example Rem2−/− neurons with (left) and without (right) visual experience. B, Average segment length of Rem2+/+ and Rem2−/− neurons exposed either to TR conditions or DR from before eye opening and sampled at P21. C, Number of dendritic segments of Rem2+/+ and Rem2−/− neurons exposed to either TR conditions or DR from before eye opening sampled at P21. D, Average segment length of Rem2+/+ and Rem2−/− neurons exposed either to TR conditions or DR from before eye opening and sampled at P30. E, Number of dendritic segments of Rem2+/+ and Rem2−/− neurons exposed to either TR conditions or DR from before eye opening sampled at P30. F, Summary of p values from all comparisons when Rem2+/+ and Rem2−/− are exposed to DR from before eye opening until P21. Yellow boxes represent significant results after multiple comparisons correction. Error bars indicate mean ± SEM. Yellow dots indicate means. Teal dots (Rem2−/−) and gray dots (Rem2+/+) indicate single neurons. For all Rem2−/− measurements: P7 TR: N = 21 cells, 2 mice; P12 TR: N = 47 cells, 4 mice; P16 TR: N = 44 cells, 4 mice; P21 TR: N = 30 cells, 3 mice; P30 TR: N = 43 cells, 4 mice; P21 DR: N = 36 cells, 4 mice. For all Rem2+/+ measurements: P7 TR: N = 24 cells, 2 mice; P21 TR: N = 33 cells, 3 mice; P21 DR: N = 32 cells, 4 mice. *p < 0.05 (two-way ANOVA with post hoc Tukey test). Table 4 provides the means ± SEM and p values for post hoc Tukey tests relating to this figure.

