Figure 2.
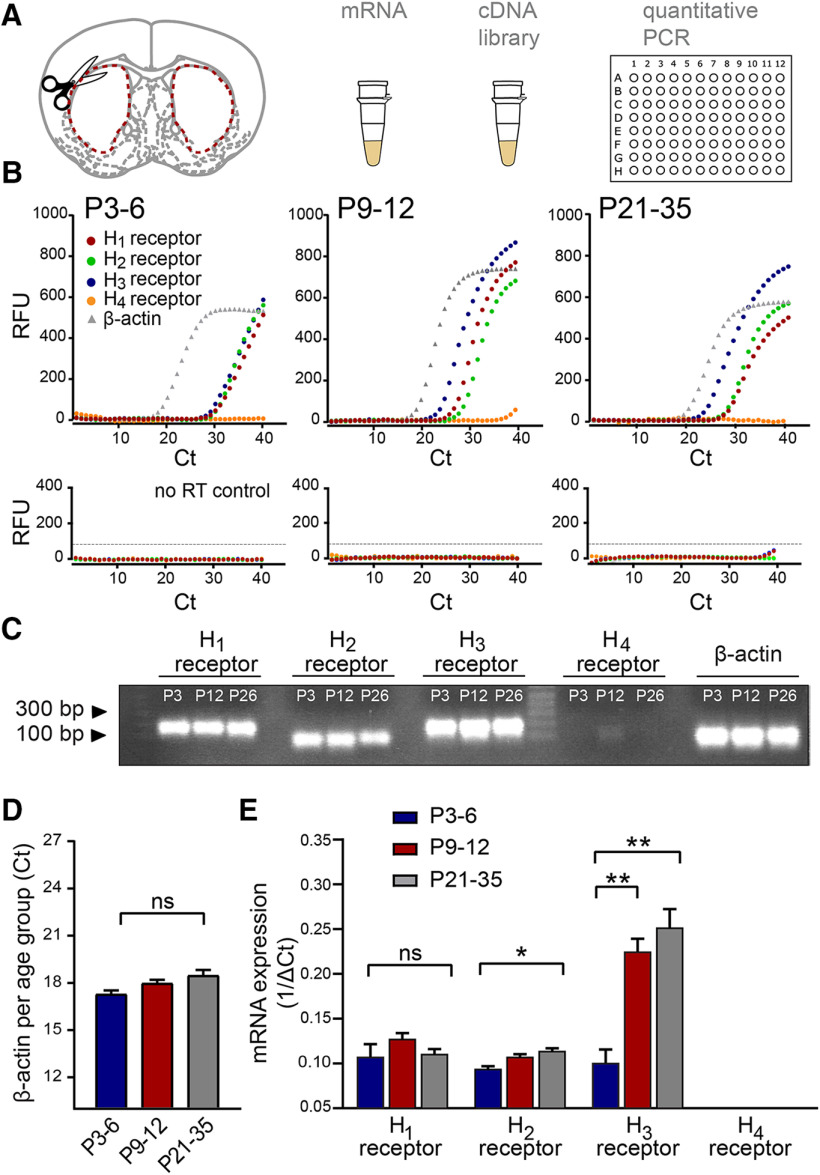
Dynamic changes in transcript levels of histamine receptors in the developing striatum. A, The striatum of both hemispheres was dissected from acute brain slices of P3–P6, P9–P12, and P21–P35 C57Bl/6 mice, and mRNA was extracted and processed for qRT-PCR. B, Representative raw amplification curves from single qRT-PCR experiments for each developmental period. The housekeeping gene β-actin (gray gradient) appeared at a similar cycle (Ct) throughout the different ranges, while the histamine receptor amplification cycles changed across development. Note the leftward shift of the histamine H3 receptor curve (blue) at P9–P12 and P21–P35 while the H1 (red) and H2 (green) receptor amplification curves remain relatively constant. Note also the lack of a significant amplification curve for the H4 receptor (orange). qRT-PCR amplification curves obtained from the no-RT samples (bottom panels) served as a control. C, Representative gel of RT-PCR products showing single bands at expected sizes for each of the transcripts in the different developmental periods. Predicted band sizes are for the H1 receptor: 175 bp; H2 receptor: 88 bp; H3 receptor: 187 bp; H4 receptor: 117 bp; and β-actin: 66 bp. D, Consistency of the β-actin cycle (Ct) amplification values at the three developmental periods. E, Transcript levels of the histamine receptors in the striatum. While the levels of transcripts for the H1 and H2 histamine receptors remained relatively constant during postnatal development, the levels for H3 receptor transcripts increased more than twofold by P9–P12 and increased further by P21–P35. No significant transcript levels for the H4 histamine receptor were detected. Values are mean ± SEM of three independent biological replicates, and each biological replicate consisted of three technical replicates (see Materials and Methods). RFU, Relative fluorescence units. ns, non-significant, **p < 0.01; *p < 0.05; ANOVA.

