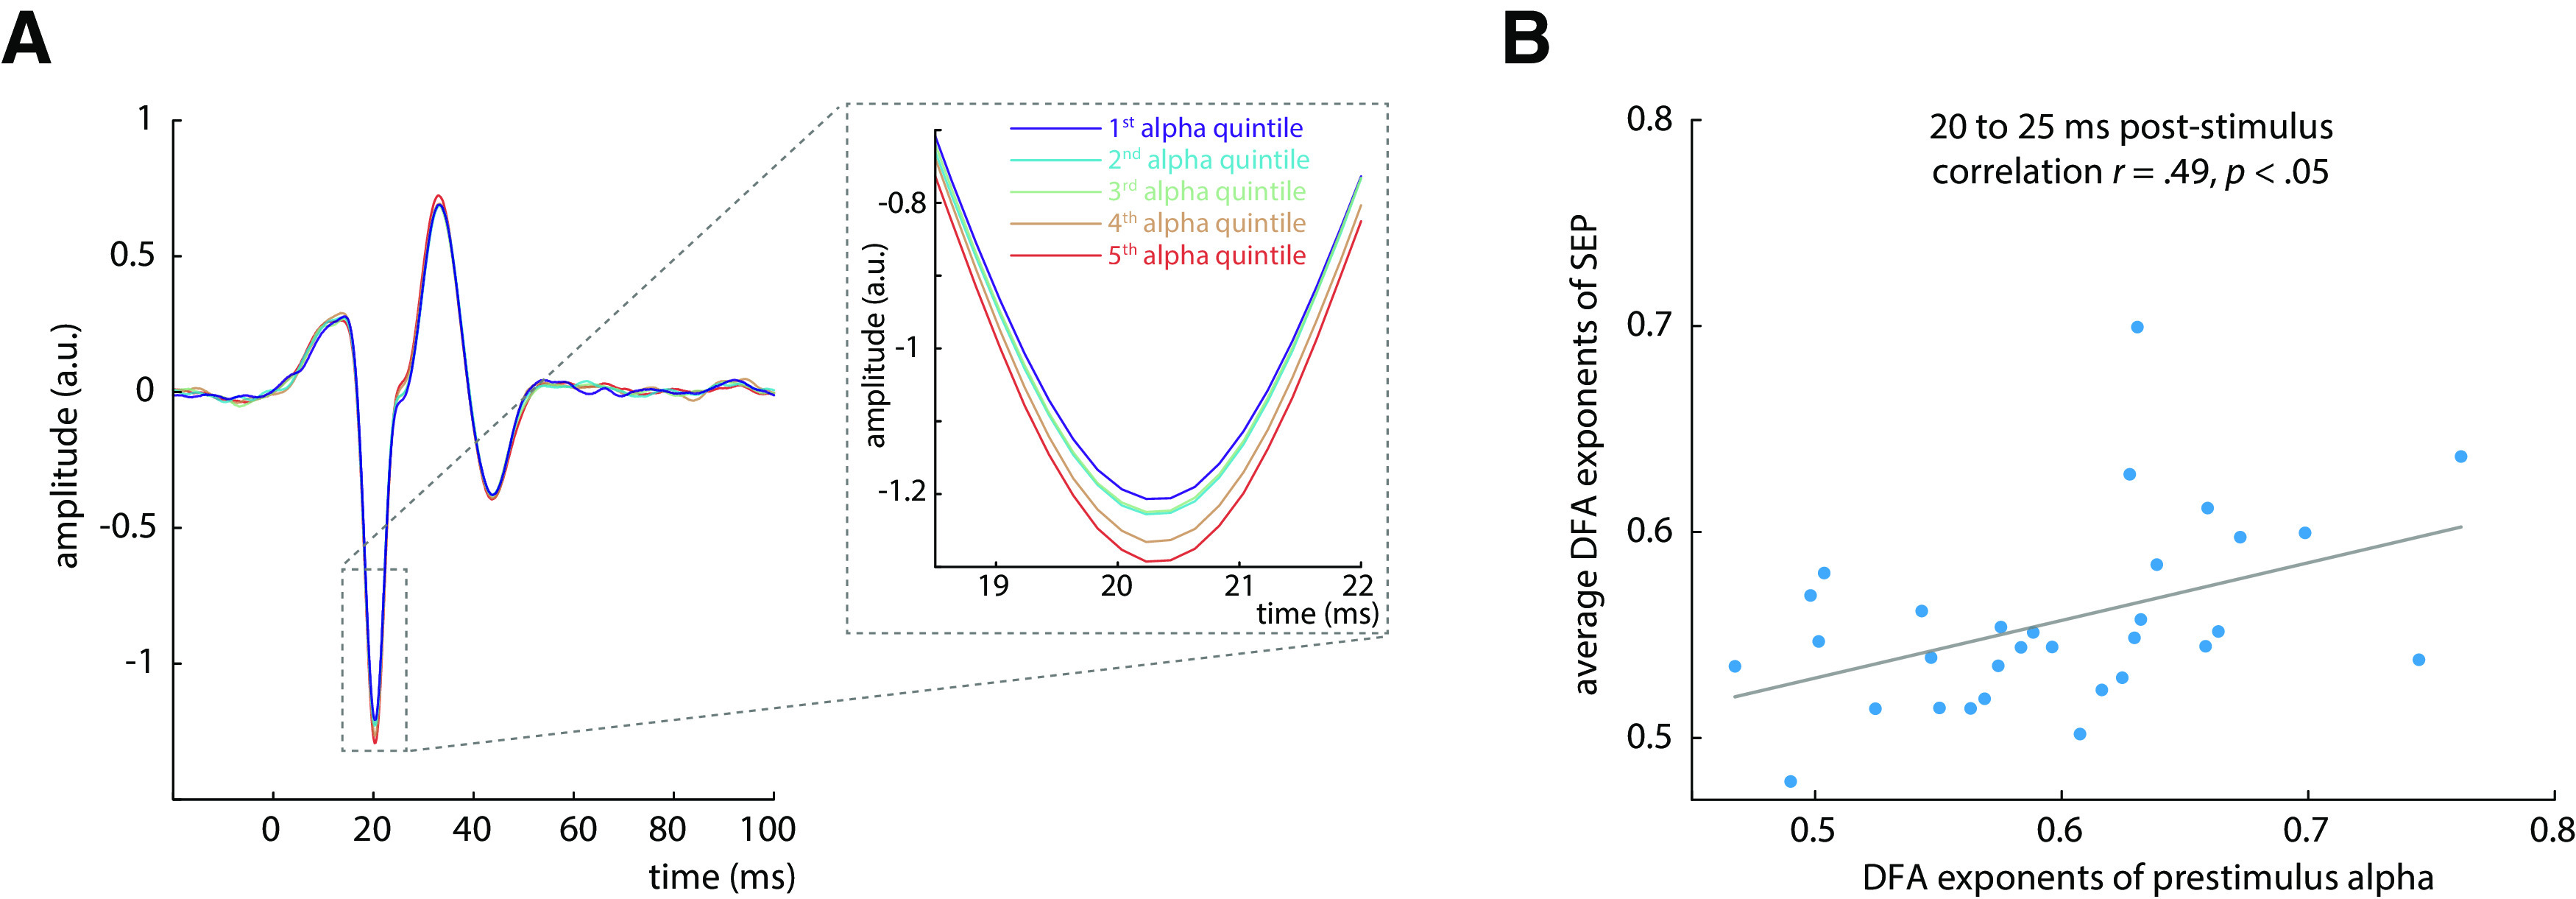
Figure 5.

Relation between amplitudes of prestimulus alpha band activity and the early SEP. A, Average SEP (tangential CCA component) plotted by quintiles of prestimulus alpha band amplitude, demonstrating their relationship with the N20 component peak (inlay). B, Relation between DFA exponents of prestimulus alpha activity and DFA exponents of the SEP in the time window from 20 to 25 (quantified using Spearman correlation). The DFA exponents of the SEP were aggregated over time points using the arithmetic mean.
