
Figure 4.
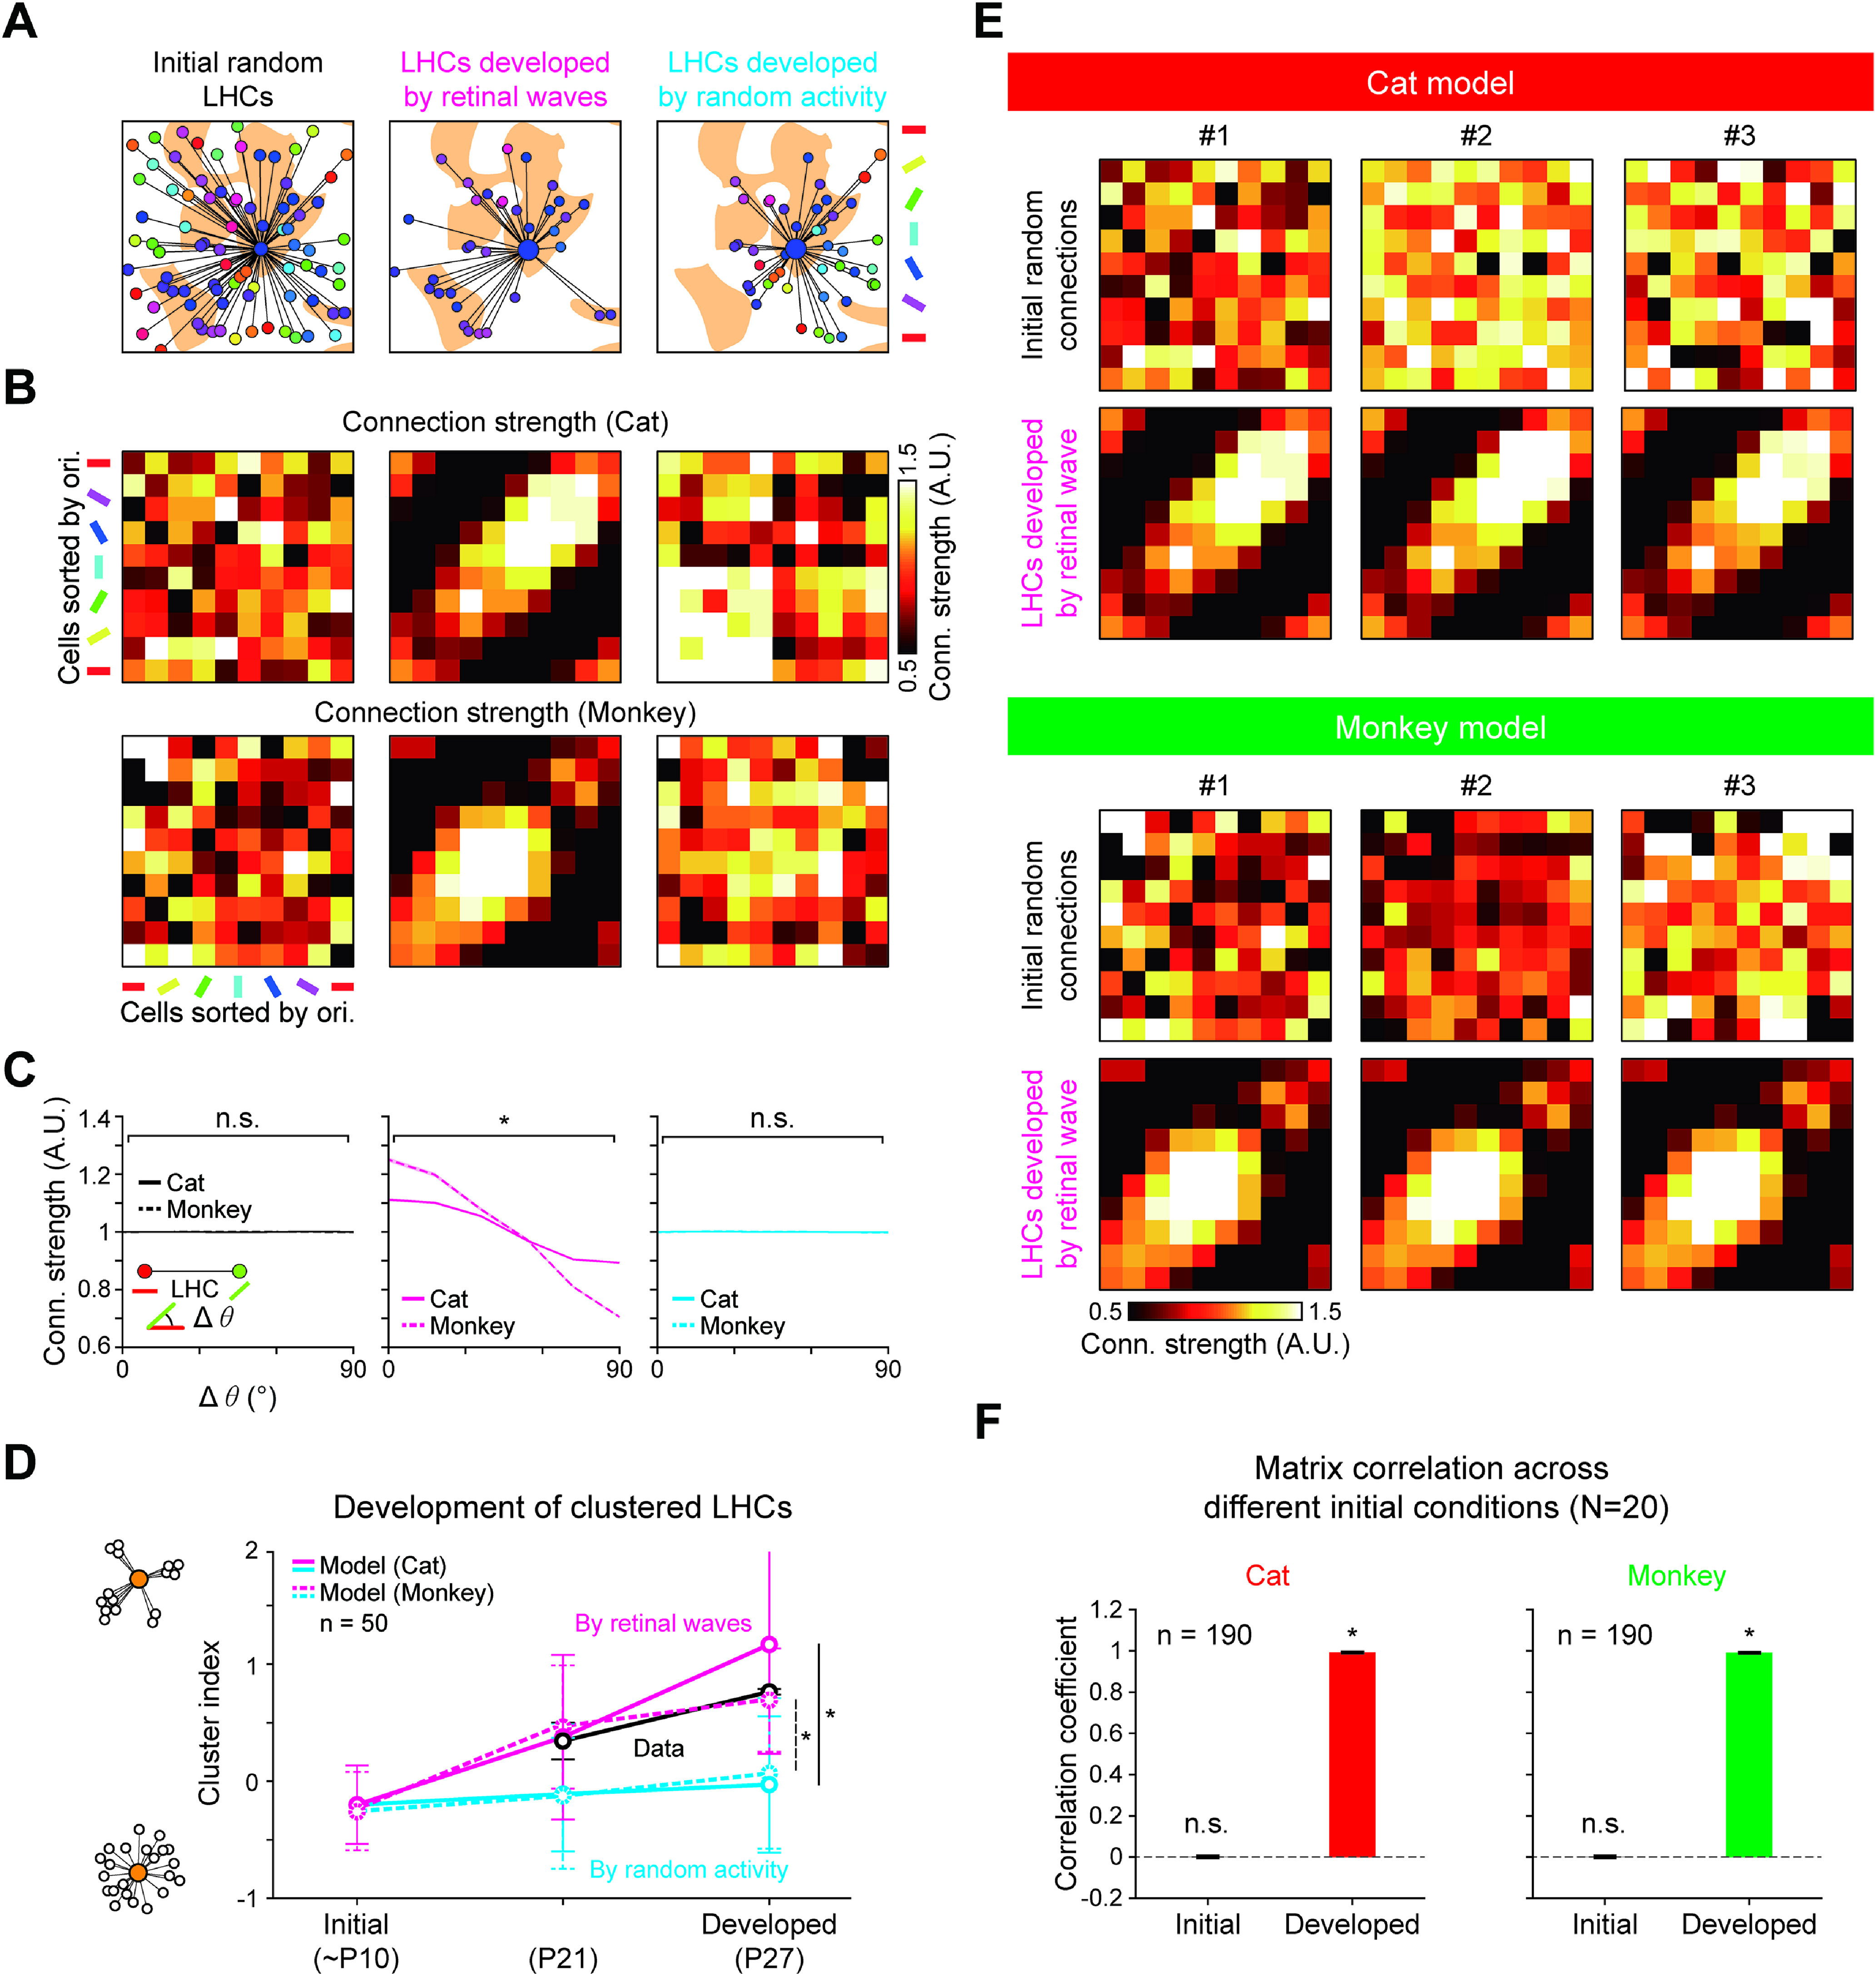
Organization of LHCs constrained by the structure of retinal afferents. A, Analysis of horizontal connection strengths in the initial random LHCs (left), LHCs developed by retinal waves (middle), and LHCs developed by randomly permuted activity (right). For each network, the locations of the top 10% of the strongest postsynaptic connections for a presynaptic location are shown over the orientation difference map. B, The average connection strength between neurons within the networks is summarized as connectivity matrices. Cells were batched into 10 subsets according to their orientation. Each pixel value denotes the average connection strength of LHCs between neurons in a pair of subsets. Connections of strength are normalized so that the average value in a network becomes unity. C, Feature-specific LHCs developed by the model. Average connection strength was plotted as a function of orientation difference. Shaded area represents SE. D, Postsynaptic clustering in developing pre-EO ferret V1 (Ruthazer and Stryker, 1996) and clustering in model V1 network developed from retinal mosaics in a cat and a monkey. Error bars indicate SD. E, Repeated developmental simulations from random initial connections. The horizontal connections develop in similar forms regardless of the initial conditions. F, Pairwise correlations between initial networks and between developed networks, across different initialization conditions (N = 20). Correlations between developed networks are close to 1, indicating convergence to a similar connectivity pattern. *p < 0.05, n.s., not significant.