Figure 1.
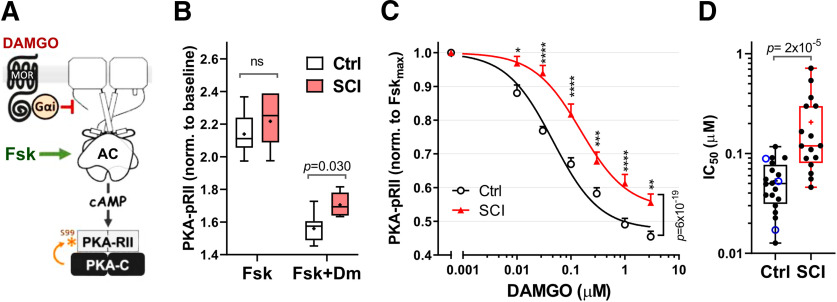
SCI reduces the effect of MOR agonist DAMGO on cAMP signaling. A, Phosphorylation of PKA-RII (S99) is used as a surrogate measurement of cAMP production in response to Fsk activation of AC and inhibition by the Gαi/o-coupled MOR agonist, DAMGO. B, DAMGO inhibition of Fsk responses in Control group (Control, white boxes, pooled Naive and Sham groups) and SCI group (Fsk 3 μm, DAMGO 0.3 μm, 5 min). PKA-pRII levels are normalized to the baseline of the unstimulated condition in each case. Control, n = 9; SCI, n = 7, compared via two-way ANOVA, followed by Sidak's multiple comparisons test. Significant p values are indicated on the graph. Box-and-whisker plot represents the median, mean (+), quartiles, and range of the data. C, Dose–response curves for DAMGO inhibition of Fsk responses (Fsk 3 μm) in Control group (black line) and SCI (red) DRG cultures. PKA-pRII data were normalized to the Fsk response in the absence of DAMGO after baseline (BL) subtraction [YNorm= (Y – BL)/(FskMax – BL)]. IC50: Control = 0.047 μm (n = 17-22); SCI = 0.15 μm (n = 15-17). Difference between groups tested by two-way ANOVA, followed by Sidak's test. *p < 0.05, **p < 0.01, ***p < 0.001, ****p < 0.0001. Data are mean ± SEM. D, IC50 values from individual DAMGO dose–response curves between Control and SCI cultures; p = 2 × 10⁻⁵, Mann–Whitney test. Control, n = 20; SCI, n = 16. In the control column, Blue empty circles represent IC50 values from Sham controls; black circles represent naive controls. Box-and-whisker plot represents the median, mean (+), quartiles, and range of the data. Detailed statistical information is provided in Table 1.

