Figure 2.
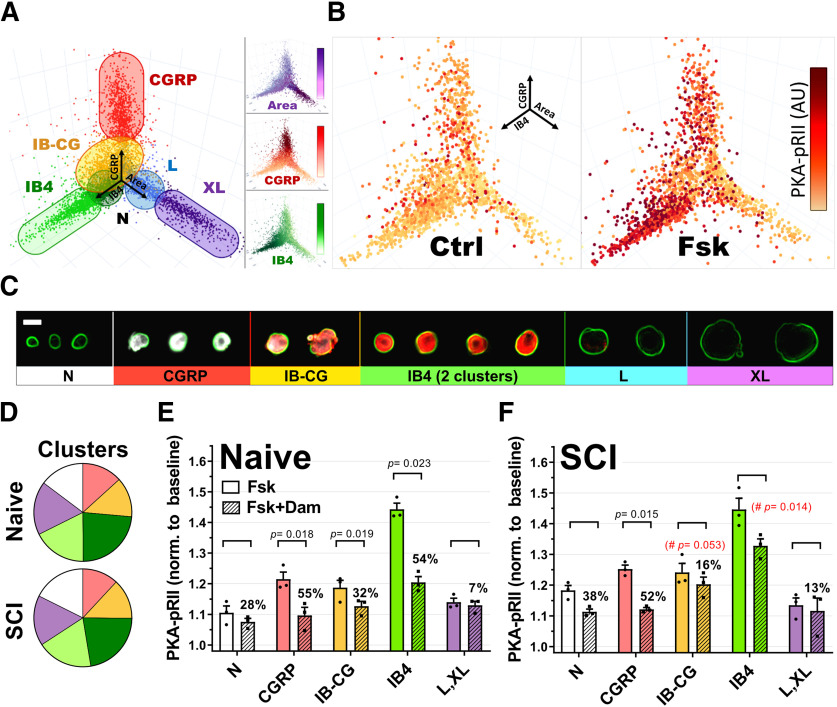
Cluster analysis of DRG neurons. A, 3D representation of DRG neurons in culture (7638 neurons) using area (X), CGRP (Y), and IB4 (Z) values as spatial coordinates. Different colors represent the seven different clusters identified by k-medians cluster analysis and plotted based on X, Y, Z coordinates. Neurons from two different IB4+ clusters are represented as a single group. B, Representative experiment showing the neuronal subgroup specificity of PKA-pRII responses to Fsk in cultured neurons from a naive animal. Dot color saturation is proportional to the intensity of PKA-pRII fluorescent values: Darker colors represent stronger PKA-pRII signals (n > 2000 neurons per condition) C, Representative examples of DRG neurons arranged according to the identified clusters in A. GGRP (white), IB4 (red), and soma size (indicated by green outline of cell membrane based on PGP9.5). Clusters include N (neurons negative for IB4 and CGRP, with small soma size), CGRP, IB-CG (weak staining for both IB4 and CGRP), IB4, and L and XL (large and extra-large soma size). Scale bar, 25 μm. D, Relative mean cluster size in the total neuronal population for naive and SCI cultures. Colors correspond to clusters in A and C. Light and dark green represent weak and strong IB4 staining clusters, respectively. No significant differences in relative cluster size were found between Naive and SCI groups (p > 0.99, n = 3 per group, two-way ANOVA, followed by Sidak's test). E, F, Fsk responses and DAMGO effects in specific neuronal clusters for naive (E) and SCI (F) cultures. n = 3 per group; DAMGO effects per cluster tested via paired t test. The % DAMGO inhibition over the control Fsk response is indicated for each group. #Red represents significance difference in DAMGO effects comparing IB-CG and IB4+ clusters from naive (E) and SCI (F) (n = 3, unpaired t test). Detailed statistical information is provided in Table 1.

