Figure 3.
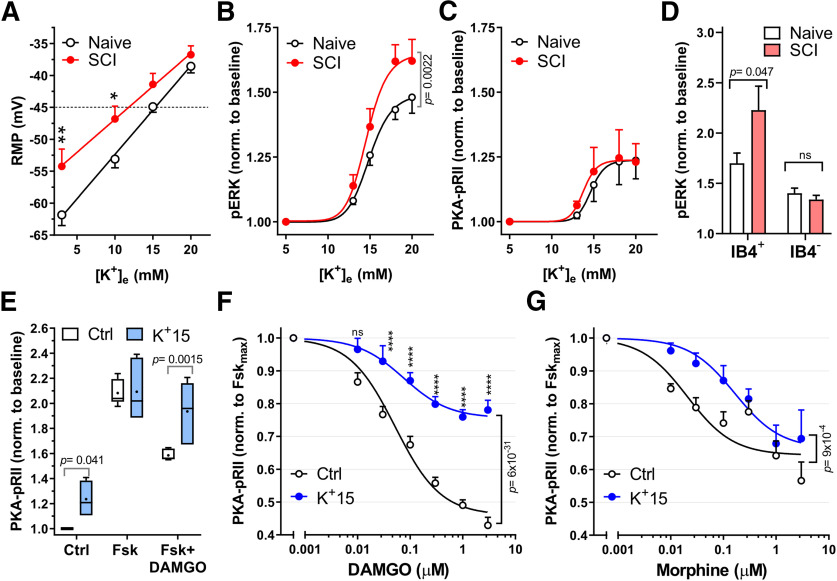
Acute depolarization activates ERK and reduces DAMGO effects on cAMP. A, RMP for Naive (black) and SCI (red) small- to medium-sized DRG neurons were measured on successive perfusions (30 s) of increasing extracellular K+ concentration, [K+]e. RMP at each [K+]e was measured when steady state was reached (n = 11). *p = 0.039; **p = 0.0081; two-way ANOVA with Sidak's test. B, C, Concentration–response curves for pERK (B) and PKA-pRII (C) to increased [K+]e. Neurons were exposed to media with indicated [K+]e for 5 min. B, Naive, n = 5-7; SCI, n = 5 per data point, C, Naive, n = 5; SCI, n = 5-7 per data point. Two-way ANOVA followed by Sidak's test. D, pERK responses to 18 mm [K+]e (5 min) for IB4+ and IB4– neuronal subpopulations in Naive and SCI DRG neurons: Naive, SCI, n = 3, p = 0.047, two-way ANOVA followed by Sidak's test. E, K+-induced depolarization decreases DAMGO responses in Naive DRG neurons. Neurons were exposed to either control media (5 mm [K+]e) or 15 mm [K+]e media during Fsk ± DAMGO (Dm) stimulation (Fsk = 3 μm, DAMGO = 1 μm, 5 min); n = 6. Control, p = 0.041; Fsk+DAMGO, p = 0.0015, two-way ANOVA, followed by Sidak's test. Box-and-whisker plot represents the median, mean (+), quartiles, and range of the data. F, Dose–response curves of DAMGO inhibition of Fsk responses in Naive DRG neurons under control conditions (black) or 15 mm [K+]e (blue). IC50 Control, 0.051 μm; IC50 K+15, 0.075 μm; Control, n = 9-19; K+15, n = 4-12 per data point. Data compared by two-way ANOVA, followed by Sidak's test: ****p < 0.0001. G, Dose–response curves of morphine inhibition of Fsk responses in naive DRG neurons with control or 15 mm [K+]e. Control IC50 = 0.021 μm; K+15 IC50 = 0.16 μm; Control, n = 3-5; K+15, n = 4 or 5 per data point (two-way ANOVA). Detailed statistical information is provided in Table 1.

